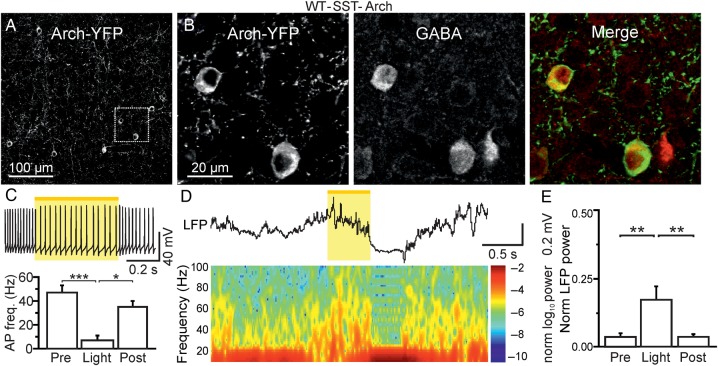
Figure 6.
Acute optogenetic reduction of firing in SST-positive cells affects ongoing network dynamics in vivo. (A) Confocal image of a cortical section from a WT-SST-Cre animal which was injected with AAV-transducing Arch-YFP. (B) A zoom in of 2 Arch-YFP-positive cells (leftmost panel) is shown. The same section shown in (B) was stained for GABA (middle panel). The merge of the 2 images is shown in the rightmost panel. (C) Top: slice recording displaying membrane potential response to yellow light pulse in a representative Arch-positive neuron. AP discharge was elicited in the recorded neuron by current injection (300 pA). Bottom: Histogram displaying the average AP frequency before (pre), during (stim), and after (post) light stimulation in N = 12 recorded cells. (D) Representative LFP trace (top) and corresponding spectrogram (bottom) showing the effect of yellow light illumination on spontaneous cortical activity in awake, head-restrained WT-SST-Cre animals which were injected with AAVs carrying a double-floxed Arch sequence. (E) Average values of normalized LFP power before (pre), during (stim), and after (post) light stimulation (N = 9 mice). LFP power was calculated in the spectral range of 30–90 Hz.

