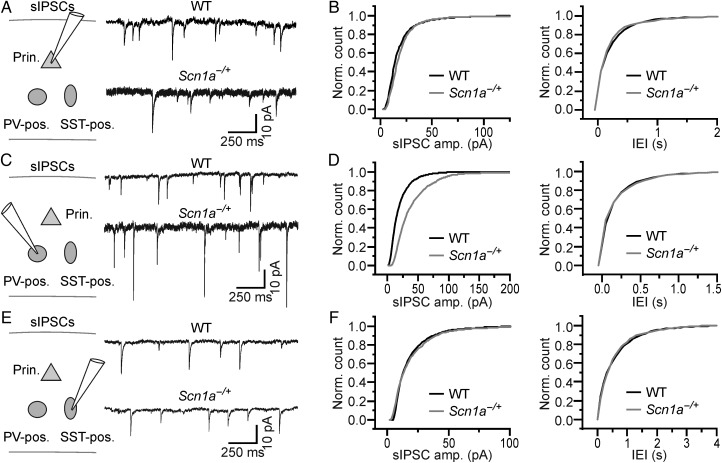
Figure 8.
Cell type-specific changes in sIPSCs in brain slices from Scn1a−/+ mice. (A) Left: schematic of the experimental configuration. Recordings were performed from principal cortical neurons. Right: sIPSCs in slices from WT (top) and Scn1a−/+ (bottom) animals recorded from principal neurons. (B) Cumulative distribution of the amplitude (left) and frequency (right) of sIPSCs recorded from WT (N = 8 cells) and Scn1a−/+ (N = 8 cells). (C,D) and (E,F) same as in (A and B) for sIPSCs recorded from PV-positive (WT, N = 8 cells; Scn1a−/+, N = 8 cells) and SST-positive (WT, N = 8 cells; Scn1a−/+, N = 8 cells) interneurons, respectively.

