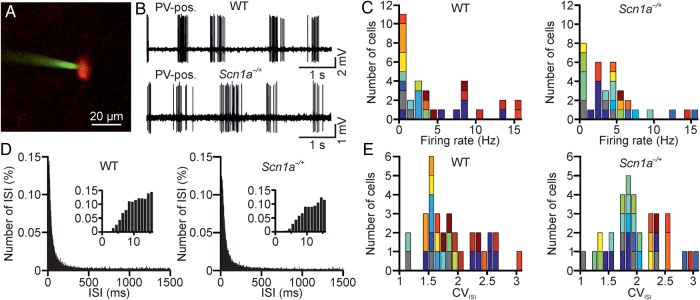
Figure 9.
Two-photon-guided juxtasomal recordings from PV-positive interneurons in vivo. (A) Two-photon image showing a Tomato-positive (red signal) layer II interneuron in an anesthetized WT-PV-Cre mouse which was crossed with a Tomato reporter mouse line. Under visual control, a glass pipette filled with Alexa 488 (green signal) is lowered within the cortical tissue until a juxtasomal recording is obtained with a genetically identified cell. (B) Juxtasomal recording from a Tomato-positive cell in a WT (top) and Scn1a−/+ (bottom) mouse. (C) Distribution of the average firing rate of recorded cells in WT (left, N = 32 cells from 15 different animals) and Scn1a−/+ (right, N = 34 cells from 14 different animals). Cells recorded from the same animal are displayed with the same color code. (D) Average (over cells) distribution of the ISI in WT (left) and Scn1a−/+ (right) for the same set of recordings analyzed in C. Bin, 1 ms. The distributions are shown at an expanded time scale in the insets. (E) Distribution of the CVISI in WT (left) and Scn1a−/+ (right). Same color code as in C.

