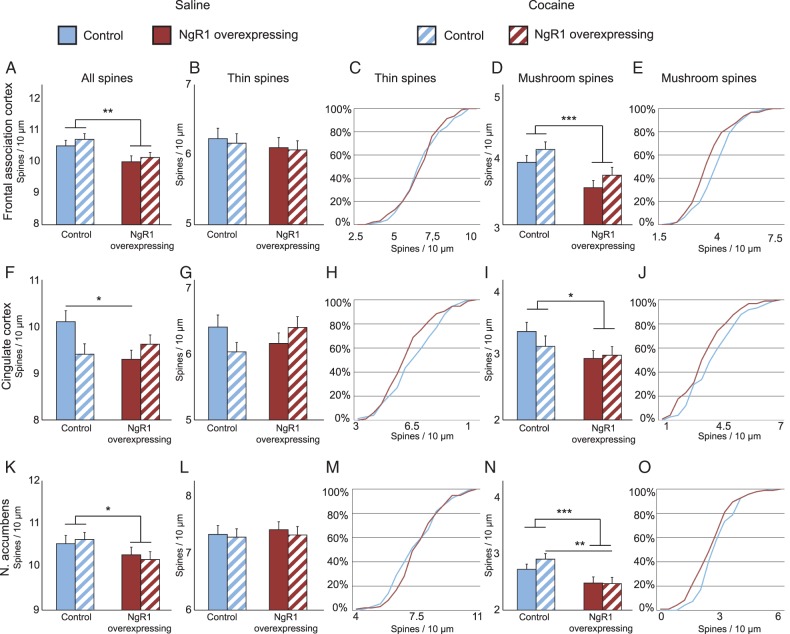
Figure 4.
NgR1 limits the number of mature mushroom spines in vivo; cocaine affects control and NgR1 overexpressing mice differently. Density of all spines (A,F,K), thin spines (B,G,L), and mushroom spines (D,I,N) in 3 brain areas from control and NgR1 overexpressing mice 24 h after last treatment with saline or cocaine. Frequency distribution charts for thin (C,H,M) and mushroom spines (E,J,O) (n > 60 neurons per group from 12 mice per group). Significances between groups with Bonferroni correction: *P < 0.05, **P < 0.01, ***P < 0.001.

