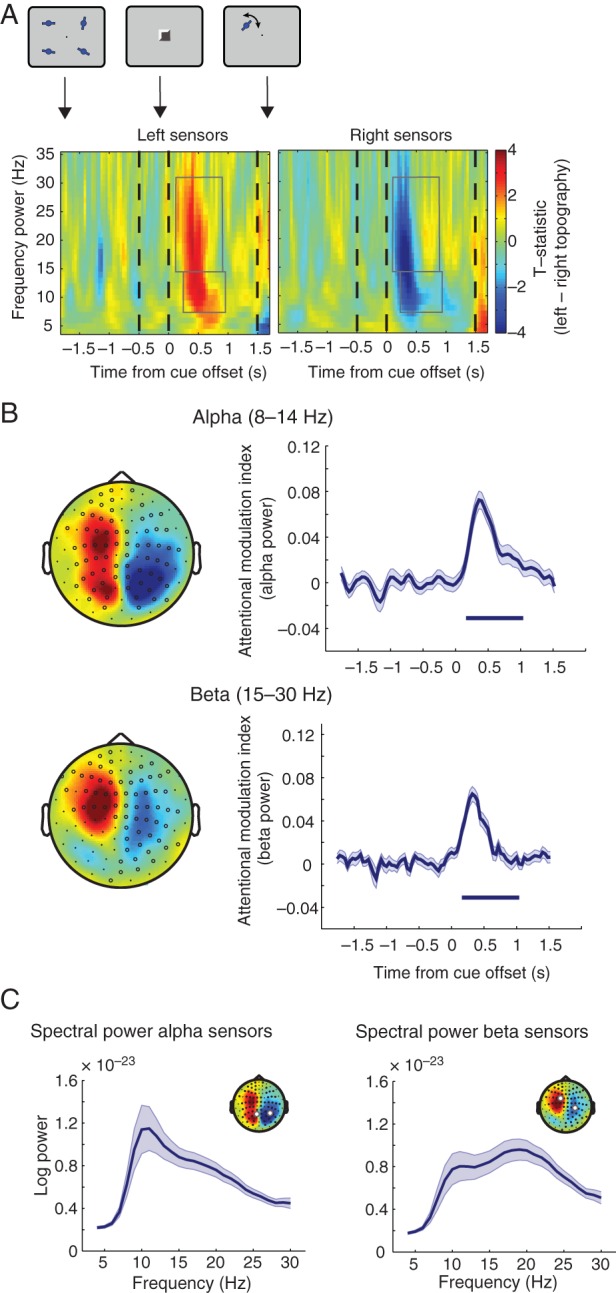
Figure 3.

Alpha and beta lateralization. (A) Time course of alpha (8–14 Hz) and beta (15–30 Hz) power lateralization from sensors for the left minus right retro-cue contrast. Left: Increase of event-related synchronization (ERS) of alpha/beta power on the ipsilateral hemisphere to the attended side following a retro-cue. Right: Decrease of ERS of alpha/beta power on the contralateral hemisphere to the attended side following a retro-cue. Gray boxes denote significant increase/decrease in lateralization for alpha and beta bands. x-Axis is time from cue offset; y-axis is frequency power. (B) Left: Topography of alpha (top) and beta (bottom) power for the left minus right retro-cue contrast at 120–800 ms (alpha) and 8–840 ms (beta) after cue offset. Right: Time course of alpha (top) and beta (bottom) attention modulation index (AMI). The AMI is the average of the ipsilateral sensors minus average of the contralateral sensors' alpha or beta power, respectively (sensor selection via a leave-one-out method; see Materials and Methods). x-Axis is time from cue offset; y-axis is AMI. The bar below the AMI denotes significant lateralization compared with zero (both alpha and beta AMI: P < 1.0 × 10⁻⁴ cluster-corrected over time). (C) Spectral power for peak alpha and beta lateralization sensors. Mean log power for each frequency from 4 to 30 Hz in 1 Hz steps at sensors that exhibited peak modulation during the period of significant alpha lateralization (120–800 ms; left) and beta lateralization (8–840 ms; right) averaged over left and right retro-cue conditions, showing separate alpha and beta spectral peaks.
