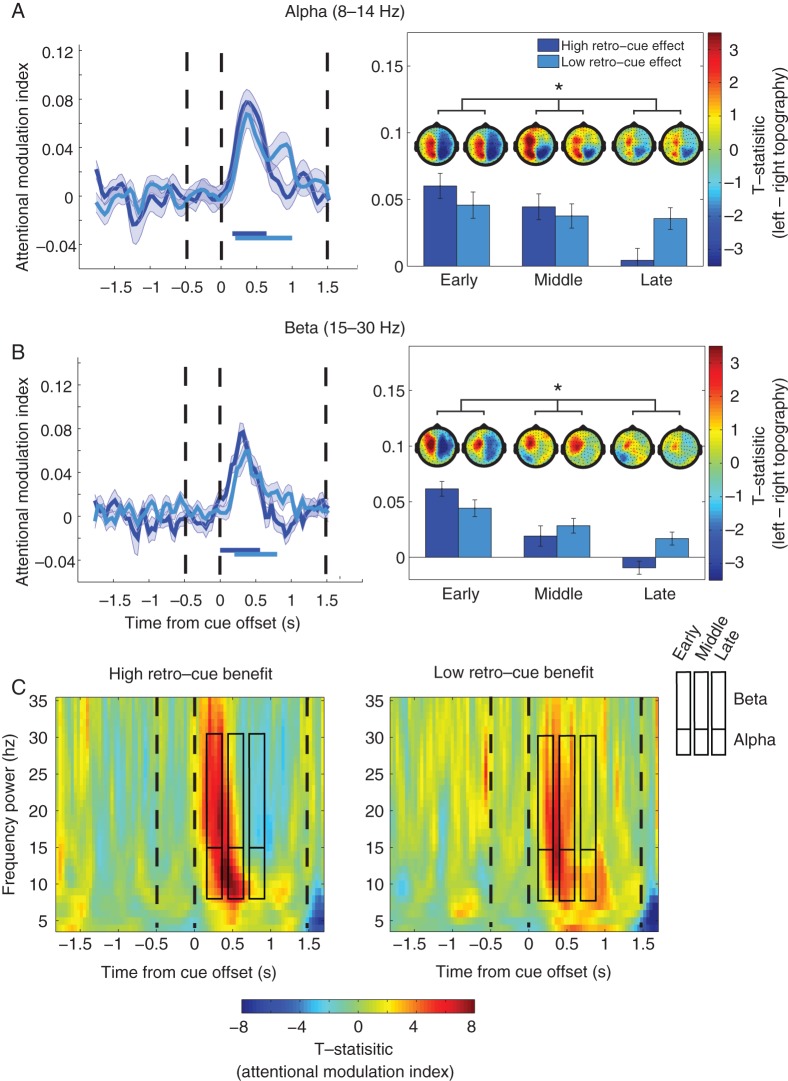
Figure 4.
Temporal profile of alpha/beta lateralization reflects magnitude of retro-cue benefit in WM accuracy. (A) Left: Time course of the attentional modulation index (AMI) for high and low cueing benefit groups in the alpha band. The high cueing group exhibited a large increase of AMI after cue offset that shortly went back to baseline, whereas the low cueing group had a numerically smaller increase of AMI that lasted for longer. Right: Bar plots showing a significant interaction between groups for the AMI in the early, middle and late periods. Topographies display t-stat images of alpha power lateralization for each group and averaged over the early, middle, and late time points above each respective bar plot. Topography color scale is kept constant with t-values of −4 to 4. The bars below the AMI denote significant lateralization (AMI significantly different from zero) in each group. (B) The same analysis is presented for beta. *Significant interaction (P < 0.05). (C) Time–frequency plots of the AMI in participants with high retro-cue benefits (left) and low retro-cue benefits (right) for visualization. x-Axis is time from cue offset; y-axis is frequency power.

