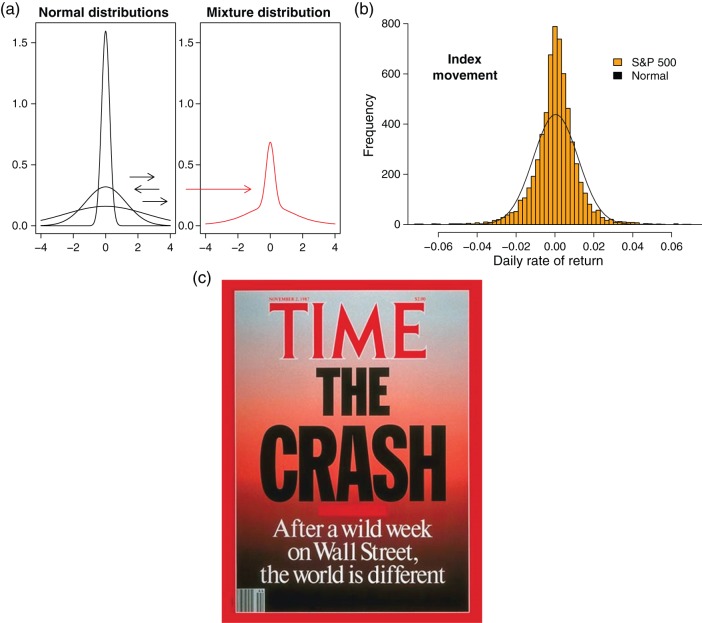
Figure 1.
(a) Random shifting in (“mixing” of) the variance of a Gaussian distribution (left) generates an outcome distribution that is leptokurtic (right); outliers are frequent and salient. (b) Histogram and fitted Gaussian curve, daily rates of return (rates of movement of value from market close in 1 day to the next) of Standard and Poor's (S&P) index of 500 major US common stock, 1 June 1988 to 28 June 2013. (c) Cover of Time magazine for the week after the October 1987 stock market crash.

