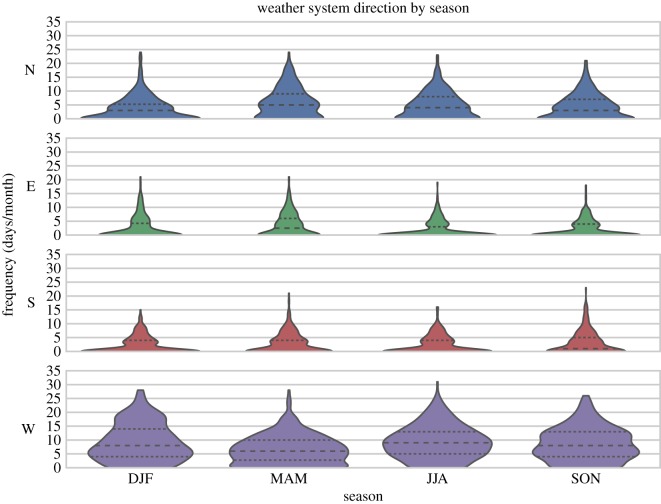
Figure 3.
Violin plots showing the frequency (days/month) with which weather systems come from cardinal compass directions, grouped by season. Standard error of the mean values were on average 0.19 days/month and did not exceed 0.36 days/month. The violins, like box plots, show the first and third quartiles and median values on horizontal lines, in addition to kernel density estimations (KDEs) reflected around the centre of the categorical sample.

