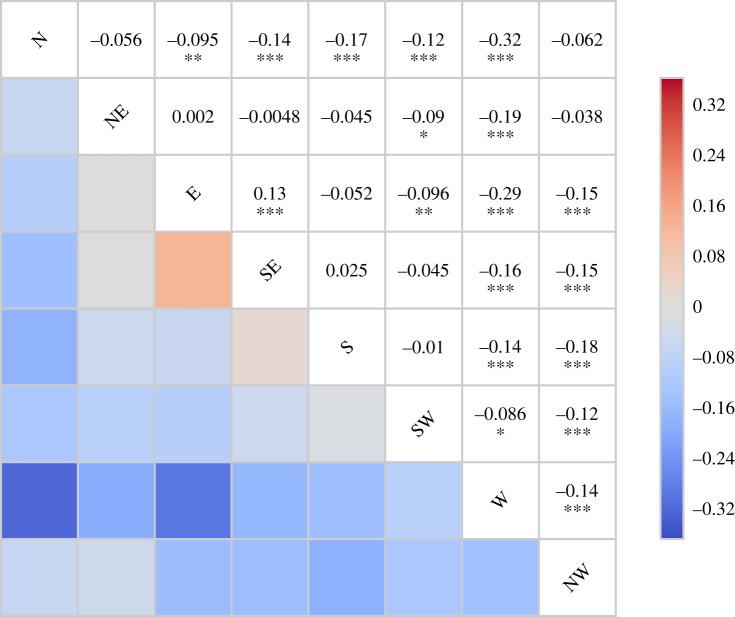
Figure 4.
Correlation matrix of Pearson’s r-values showing the associations between the frequency (days/month) of various weather system directions. The strongest (anti-correlated) relationship is between western and northern flows. The statistical significance from permutation tests is indicated by asterisks. The correlation pattern and statistical significance remain when the data are deseasonalized.

