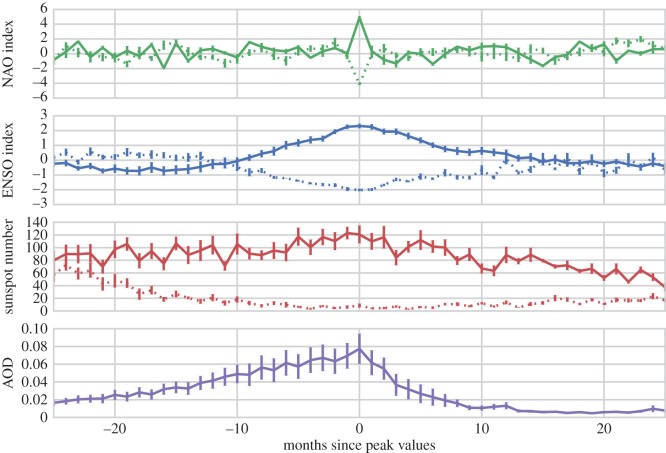
Figure 6.
Superposed epoch (composite) samples for extreme phases of the various forcings shown in figure 5. For NAO and ENSO indices, the values are ranked, and the n=11 most extreme months from Jan 1801 to Dec 2000 (non-overlapping within a period of ±365 days) are selected as samples. The composite samples representing the extreme phases of the 11 year SC are identified from the months of solar maximum and solar minimum (n=11). Uncertainty ranges show ±1 s.e.m.

