
Figure 7.
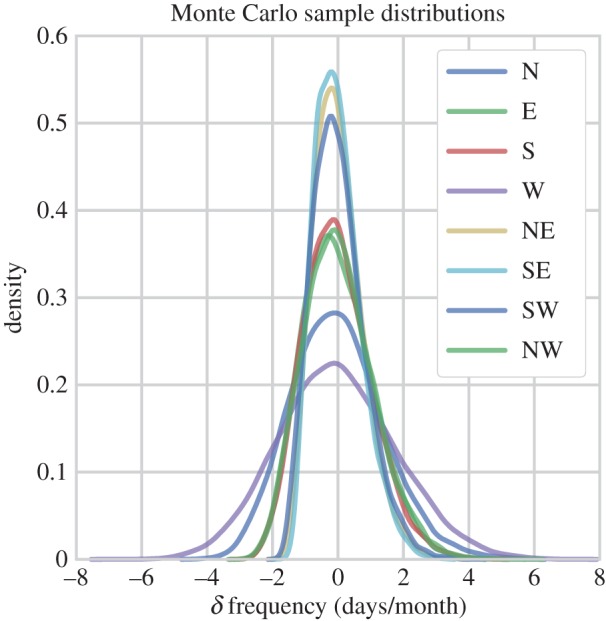
Kernel density estimates (KDEs) of deseasonalized (δ) WSD frequency (days/month) composites (n=11). The distributions were generated by MC sampling, in each instance creating 10 000 random composites. The distributions essentially show the range of values covered by the null hypothesis. That is, the variation in δ frequency with which weather systems may be expected from each direction in the absence of a forcing agent. KDEs estimated using the Seaborn.kdeplot Open Source software.