Figure 3.
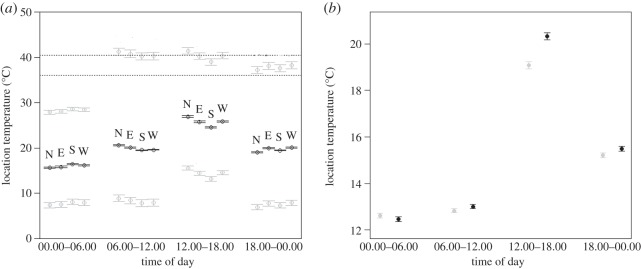
(a) Predicted temperatures for natural nests as a function of nest orientation (‘E’: n=4, ‘N’: n=3, ‘S’: n=6, ‘W’: n=6 nests) and the time period in the day. Nest temperatures are predicted for mean (‘black’ medial series), maximum (‘grey’ top series) and minimum (‘grey’ bottom series) atmospheric temperature values recorded during each time of day period; data were collected in October 2010 (11 days) and January–February 2012 (11 days). Vertical bars represent 1 s.e. Top and bottom dotted horizontal lines indicate lethal (40.5°C) and normal (36°C) incubation temperatures, respectively. (b) Predicted nest temperatures at different periods of the day for natural nests that are either experimental nests without roofs (n=4; ‘black’ symbols) or control nests with intact roofs (n=4; ‘grey’ symbols); data were collected in October 2010 (average atmospheric temperature=15.9°C). Vertical bars represent 1 s.e.

