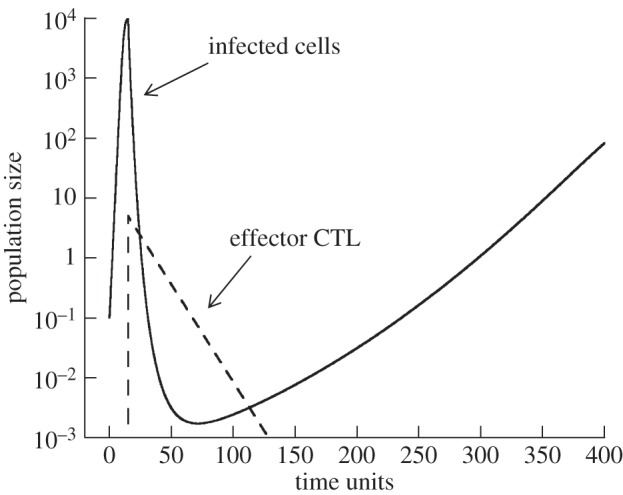
Figure 1.

Simulation of model (2.1). The virus population is depicted by the solid line, the effector CTL by the dashed line. Virus growth starts at time zero, and the CTL population is introduced at a later time point. Upon introduction of the CTL, the virus population declines. Owing to the simplicity of the model, the CTL population also declines and is not maintained in the long term. Following the CTL decline, the virus population re-grows. The minimum virus load achieved by CTL-mediated activity is a measure of the effectiveness with which the acute CTL reduce virus load. We examine how this minimum depends on the timing of CTL introduction under different parameter regimes. Parameters were chosen as follows: λ=1, d=0.0001, β=0.0001, a=0.0002, b=0.075, k=0.25. Initial conditions were as follows: S(0)=λ/d, I(0)=0.1.
