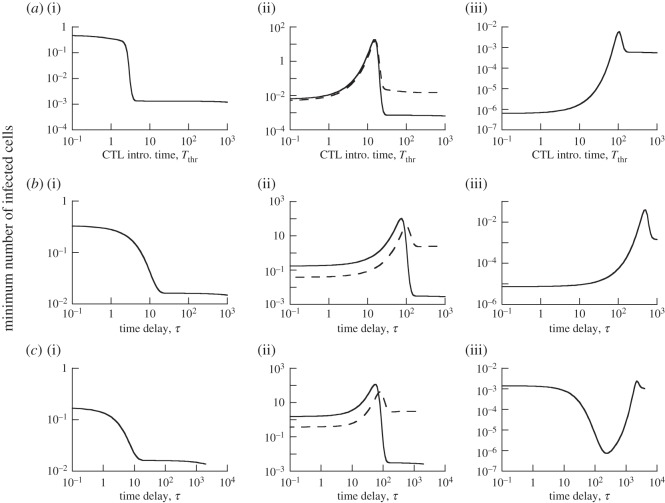
Figure 2.
Dependence of minimum virus load on the delay with which effector CTL arrive at the site of the infection, for models ((2.1)–(2.3)). For each delay (or CTL introduction time), the models were simulated, giving rise to a time series similar to the one seen in figure 1. The minimum virus load was determined and plotted. (a) Model (2.1), (b) model (2.2) and (c) model (2.3). For (a–c), panels (i)–(iii) show the dependence for different parameter combinations. A dashed curve in some of the graphs shows the dependence for an increased turnover rate of the target cell population, with other parameters remaining identical. Specifically, the parameters were chosen as follows. (a) λ=1, d=0.0001, a=0.0002, b=0.075, k=0.25. Upon introduction, Z=5. (a(i)) β=0.0004; (a(ii)) β=0.00006, dashed line: λ=100, d=0.01; (a(iii)) β=0.00001. (b) λ=1, d=0.0001, a=0.0002, b=0.075, k=1, α=0.5, g=0.01, r=1. (b(i)) β=0.00005; (b(ii)) β=0.00001, dashed line: λ=100, d=0.01; (b(iii)) β=0.000002. (c) Basic parameter same as for (b), with the additional parameters p=1, u=1, u0=1, η=0.5. (c(i)) β=0.00005; (c(ii)) β=0.00001, dashed line: λ=100, d=0.01; (c(iii)) β=0.0000005. The initial conditions were as follows: S(0)=λ/d, I(0)=0.1, R(0)=0.2, V (0)=V 0(0)=0, all other variables were set to zero.

