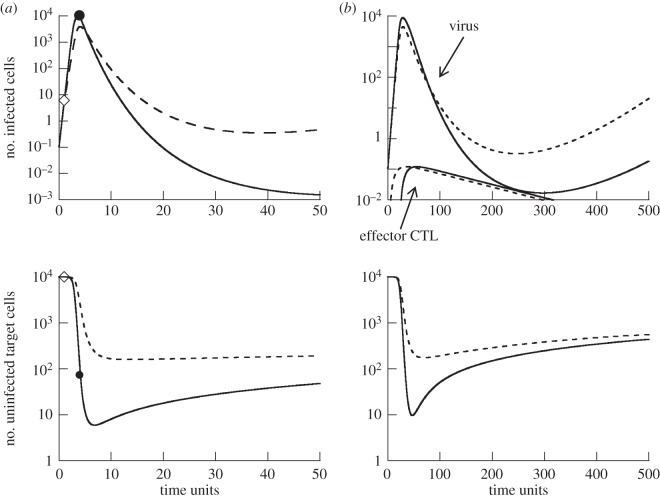
Figure 3.
Time-series simulations comparing the dynamics for shorter (dashed line) and longer (solid line) CTL delays. (a) Simulation of model (2.1). The diamond symbol indicates the point at which the CTL population is introduced for the short delay scenario, and the circle indicates the CTL introduction time for the longer delay scenario. (b) Simulation of model (2.2). The upper panel that shows the virus load curves also shows the dynamics of the CTL effector populations, as this model explicitly describes clonal expansion. Parameters were chosen as follows. (a) λ=1, d=0.0001, β=0.0004, a=0.0002, b=0.075, k=0.25. Initial conditions: S(0)=λ/d, I(0)=0.1. (b) λ=1, d=0.0001, β=0.00005, a=0.0002, b=0.075, k=1, α=0.5, g=0.01, η=0.5, r=1. Initial conditions: S(0)=λ/d, I(0)=0.1, R(0)=0.2, V (0)=V0(0)=0, all other variables were set to zero.

