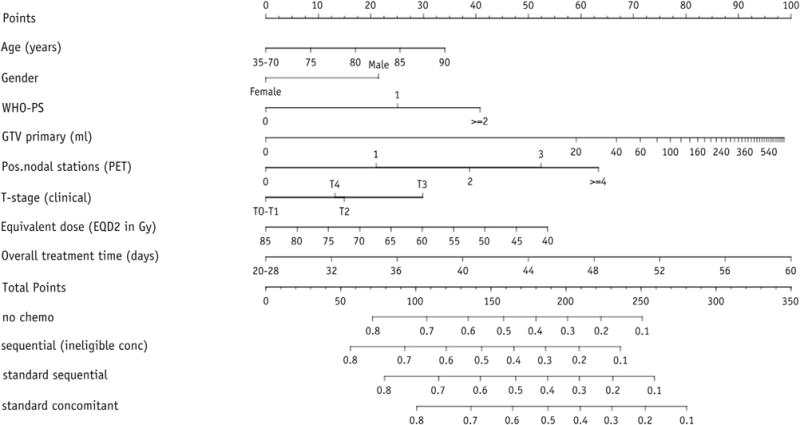
Fig. 3.

Nomogram for prediction of 24-month overall survival. The outcome is a point estimate; 95% confidence intervals can be obtained from the website www.predictcancer.org. Instructions for physician: Locate the patient’s age on the age axis. Draw a line straight upward to the points axis to determine how many points a patients receives for age. Repeat this process for the other axes, each time drawing straight upward to the points axis. Sum the points achieved for each predictor, and locate this sum on the “Total points” axis. Draw a line straight down to assess the survival probability for this patient. EQD2 = equivalent dose in 2-Gy fractions; GTV = gross tumor volume; PET = positron emission tomography; WHO-PS = World Health Organization performance status.
