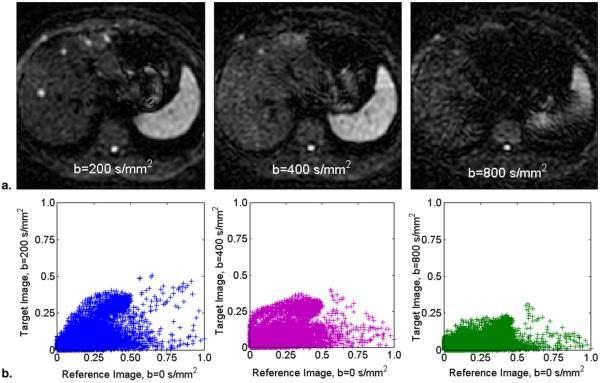
Figure 2.
Images obtained using motion correction of multi-b-value diffusion-weighted imaging. (a) Images obtained with diffusion sensitivity parameters 200, 400, and 800 s/mm2. (b) Scatter plots corresponding (from left to right) to the images shown in (a). By comparing the plots, we can detect if the mutual information or pixel distance can be used as a similarity measure. Reduced signal can limit the accuracy of motion correction. We used the criteria sum(abs(HX-HY))<0.5, where HX and HY are the normalized standard entropy of the source and target images. For the plots, the sum(abs(HX-HY))values corresponding to b-values 200, 400 and 800 s/mm2 were 0.34, 0.45, and 0.74, respectively, suggesting that b-values >400 s/mm2 result in images with low signal and contrast.

