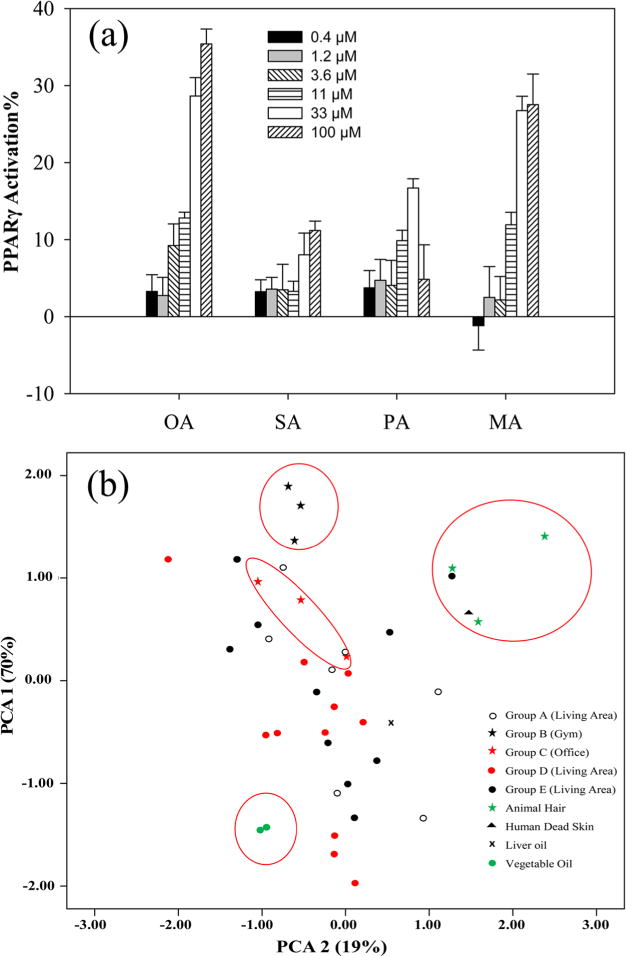
Figure 3.

(a): Dose–response relationship of PPARγ activation by four FAs including OA, SA, PA, and MA. Values represent the average of triplicate measurements, and error bars represent standard deviation; (b): Score plot of the contribution (%) of OA, PA, SA, and MA to the sum of the FAs in 35 house dust extracts and several possible sources using principle component analysis (PCA).
