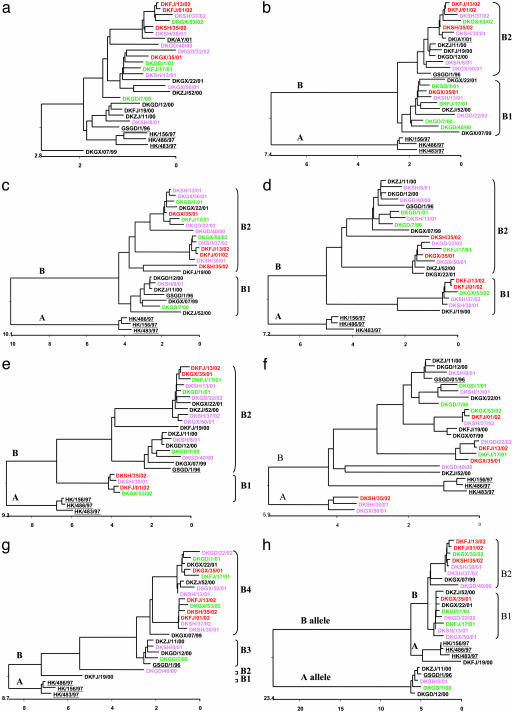
Fig. 2.
Phylogenetic trees for the HA (a), NA (b), PB2 (c), PB1 (d), PA (e), NP (f), M(g), and NS (h) genes of the H5N1 influenza A viruses analyzed. The trees were generated by using megalign software (DNASTAR) on the basis of the following gene sequences: nucleotides 29–1,732 (1,704 bp) of HA, 21–1,367 or 1,427 (1,347 or 1,407 bp) of NA, 28–2,304 (2,276 bp) of PB2, 25–2,295 (2,271 bp) of PB1, 25–2,172 (2,148 bp) of PA, 45–1,539 (1,495 bp) of NP, 26–781 (756 bp) of M, and 27–708 or 725 (682 or 699 bp) of NS. The length of each pair of branches represents the distance between sequence pairs, and the units at the bottom of the tree indicate the number of substitution events. The colors indicate the pathotypes identified in mice: red, high pathogenicity; pink, medium pathogenicity; green, low pathogenicity; black, nonpathogenic. Table 1 lists the name of the viruses; sequences of the underlined viruses were obtained from GenBank.

