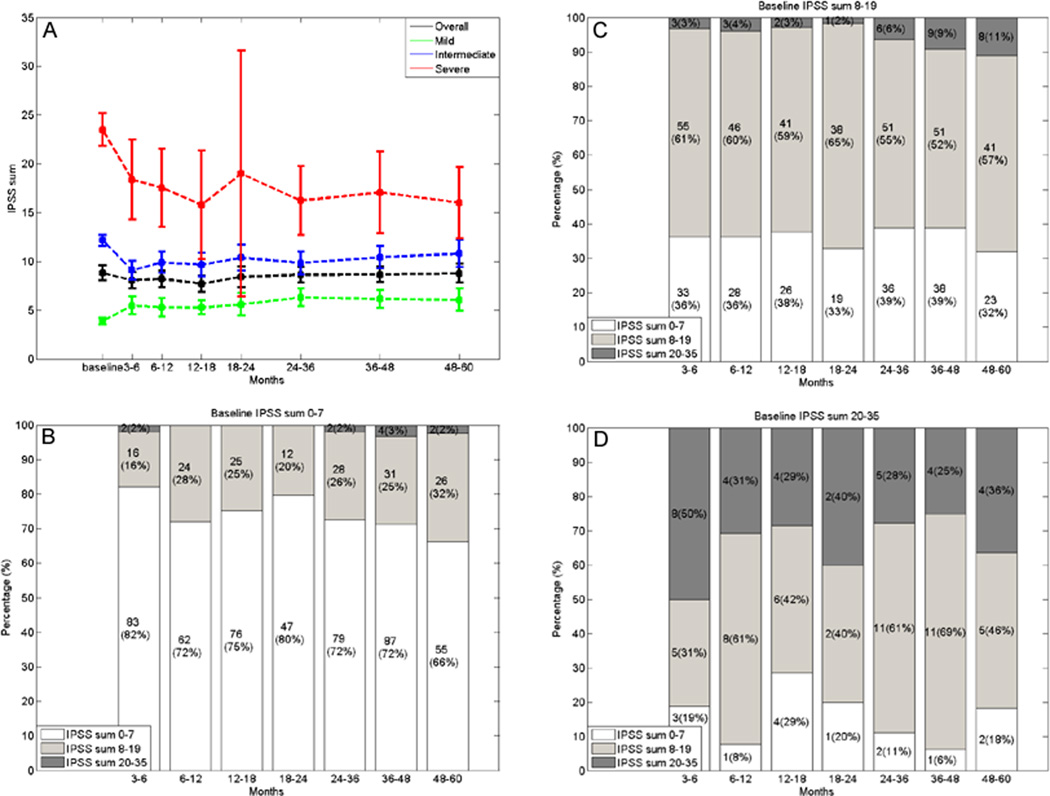
Fig. 1.
Line chart showing the mean IPSS sum at baseline and during follow-up for all patients, stratified to their baseline function (mild, moderate, severe) with the 95% confidence intervals. (A) Bar chart showing the proportion of patients having an IPSS sum of the mild, moderate or severe category during follow-up, stratified to patients with mild (B), moderate (C), or severe (D) baseline symptoms. IPSS = International Prostate Symptom Score.

