
Figure 13.
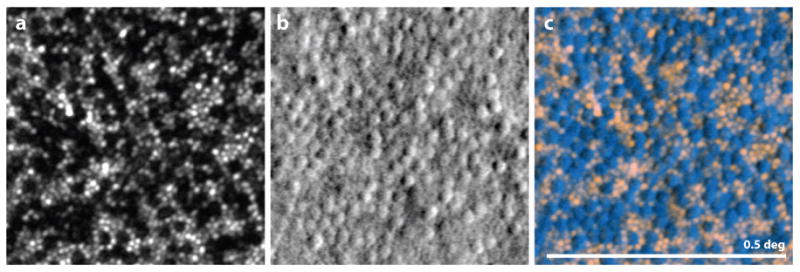
from (Scoles et al 2014b) Image showing the value of split detector imaging for prescreening patients. All images are from the same location of a single patient with achromatopsia. (A) Confocal AOSLO image. Holes are present where the cones might normally reside. The visible spots are from intact, functional rods. (B) Split-detector AOSLO, where a mosaic of structures is present, presumably the inner segments of the cones. (C) Overlay of the confocal image (pink) with the split detector image (blue) revealing that the mosaic of cells corresponds directly with the gaps in the mosaic from the left image. In this case, it appears that although the cones are dysfunctional in this patient, there is a mosaic of inner segments present. It is suggested that patients with this phenotype are most likely to benefit from gene therapy. Scale bar is 0.5 deg.