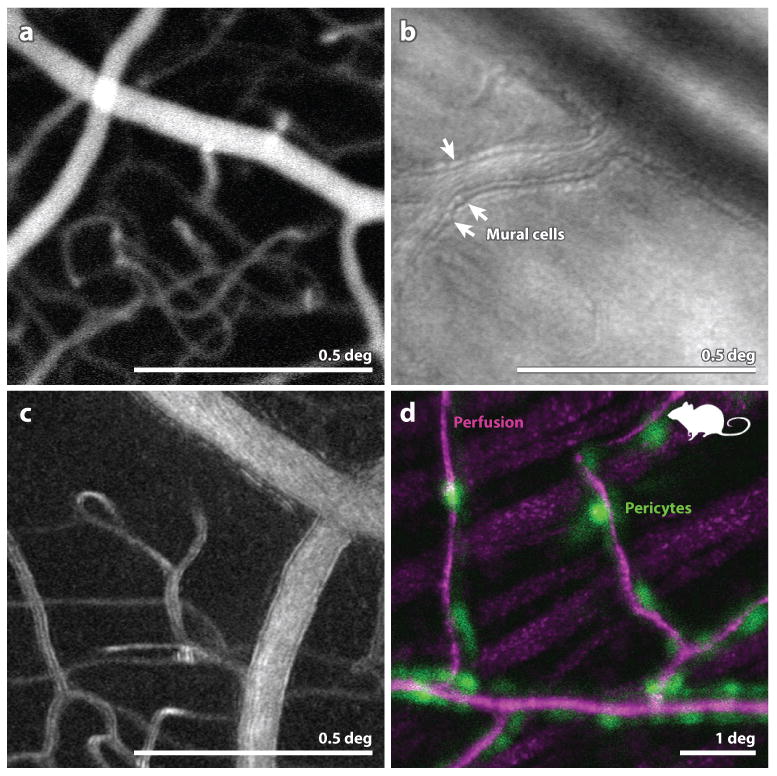
Figure 3.

(A) (from (Pinhas et al 2013)) Fluorescein angiography with AOSLO. This particular implementation employed oral fluorescein, offering a longer time course for imaging and avoiding risks associated with injection. The use of AOSLO offers higher contrast and higher resolution over conventional FA. (B) from (Chui et al 2013) Image of the microvascular structure using offset-pinhole AOSLO. Arrowheads point to purported individual mural cells comprising the arteriole walls. (C) from (Sulai et al 2014) Motion contrast image from split-detector AOSLO recordings of a vessel and capillary network in a normal eye. The scale bar is 0.5 deg and applies to panels (A) (B) and (C). (D): from (Schallek et al 2013) A combination of confocal AOSLO motion contrast of perfusion (magenta) and fluorescent AOSLO images of tagged pericytes (green) in a mouse retina reveals the colocation of these structures. Scale bar is 1 deg.
