Figure 4.

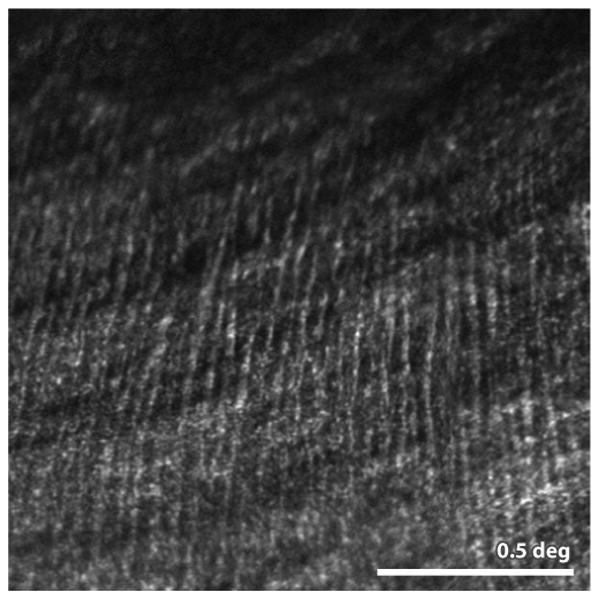
(Scoles et al 2014a) Confocal AOSLO image of a patients with Best's disease. Purported Henle fibers are running vertically across most of the image. Larger more horizontally-oriented structures are from the NFL. Scale bar is 0.5 deg.

(Scoles et al 2014a) Confocal AOSLO image of a patients with Best's disease. Purported Henle fibers are running vertically across most of the image. Larger more horizontally-oriented structures are from the NFL. Scale bar is 0.5 deg.