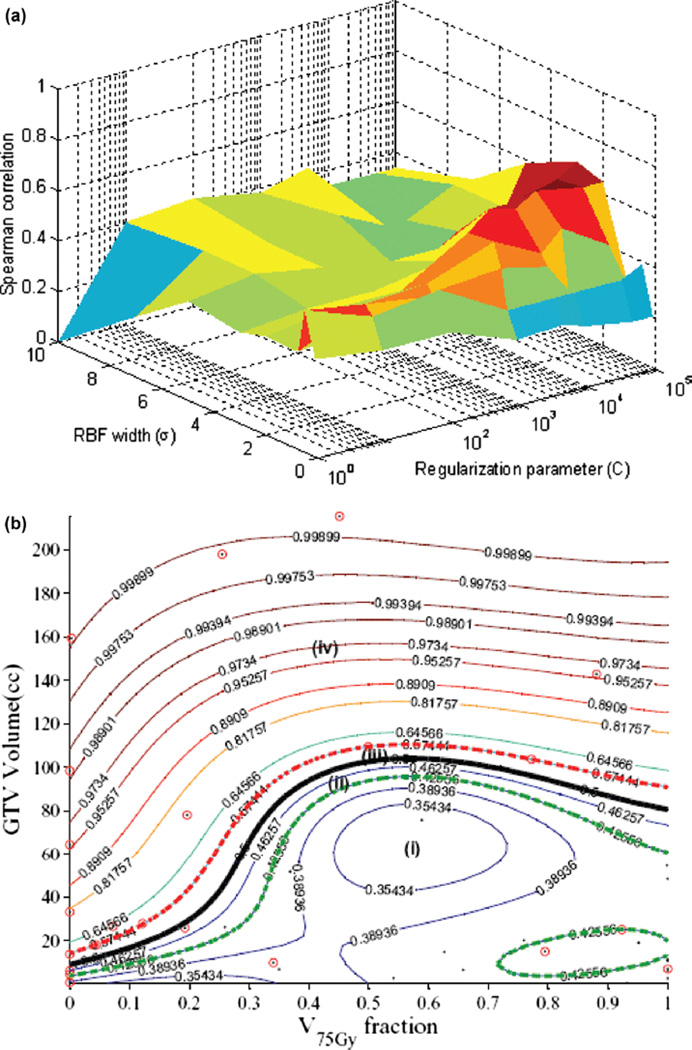
Figure 6.
Kernel-based modeling of TCP in lung cancer using the GTV volume and V75 with support vector machine (SVM) and a radial basis function (RBF) kernel. Scatter plot of patient data (black dots) being superimposed with failure cases represented with red circles. (a) Kernel parameter selection on LOO-CV with peak predictive power attained at σ = 2 and C = 10000. (b) Plot of the kernel-based local failure (1-TCP) nonlinear prediction model with four different risk regions: (i) area of low risk patients with high confidence prediction level; (ii) area of low risk patients with lower confidence prediction level; (iii) area of high risk patients with lower confidence prediction level; (iv) area of high risk patients with high confidence prediction level. Note that patients within the “margin” (cases ii and iii) represent intermediate risk patients, which have border characteristics that could belong to either risk group.

