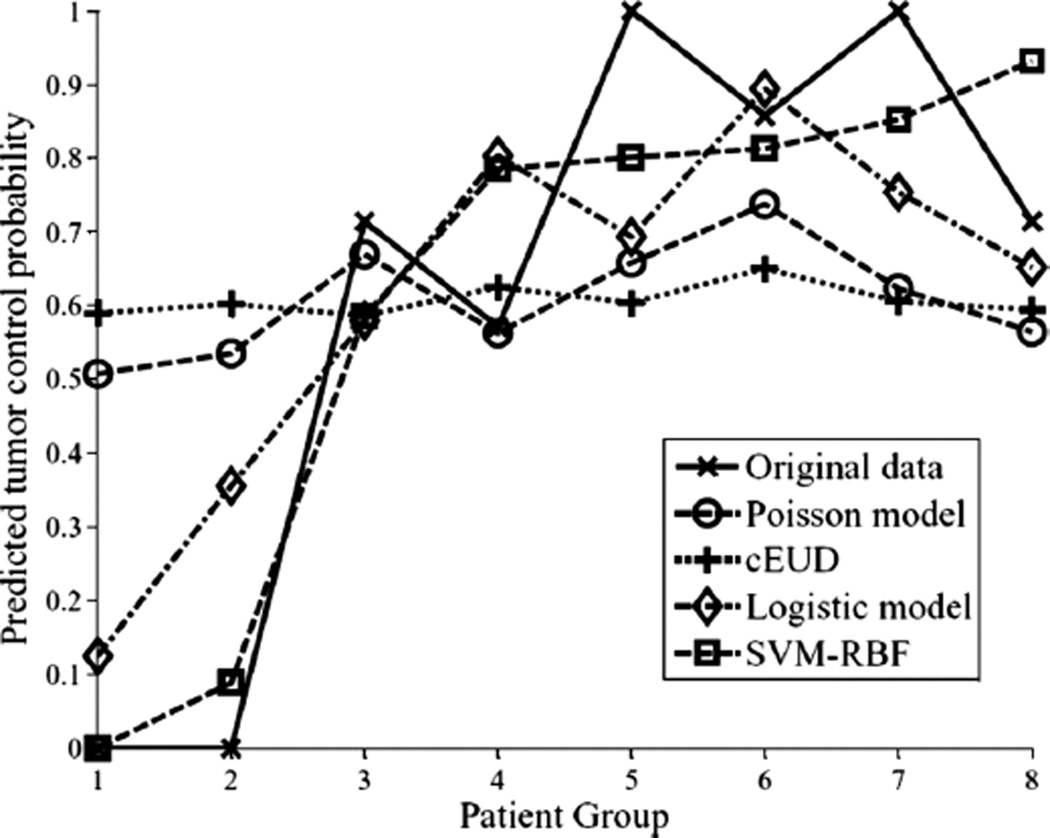
Figure 7.
A TCP comparison plot of different models as a function of patients’ being binned into equal groups using the model with highest predictive power (SVM-RBF). The SVM-RBF is compared to Poisson-based TCP, cEUD, and best 2-parameter logistic model. It is noted that prediction of low-risk (high control) patients is quite similar; however, the SVM-RBF provides a significant superior performance in predicting high-risk (low-control) patients.

