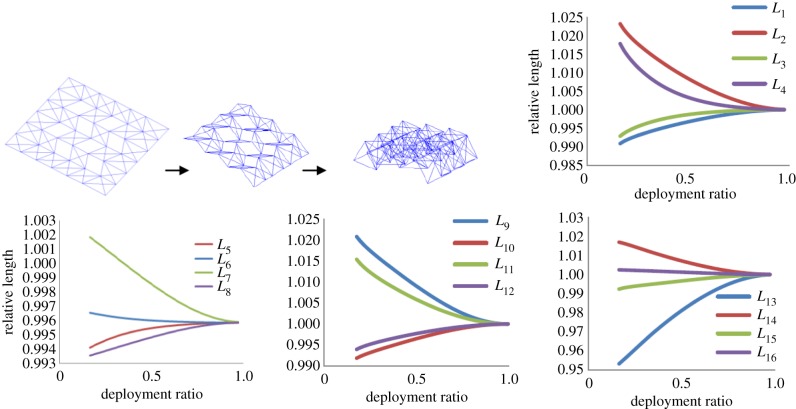
Figure 13.
The result of the extended rigid-origami simulations. The folding process is visualized by space-frame truss model (top left). The graphs show the history of the length of diagonal lines during the folding process. The relative length is defined as the ratio of the current length of each diagonal line to the original length at the completely unfolded condition. The degree of deployment is represented by the pilot angle ρ1. The transverse axes of the graphs use the deployment ratio defined as D=(180−ρ1)/180.

