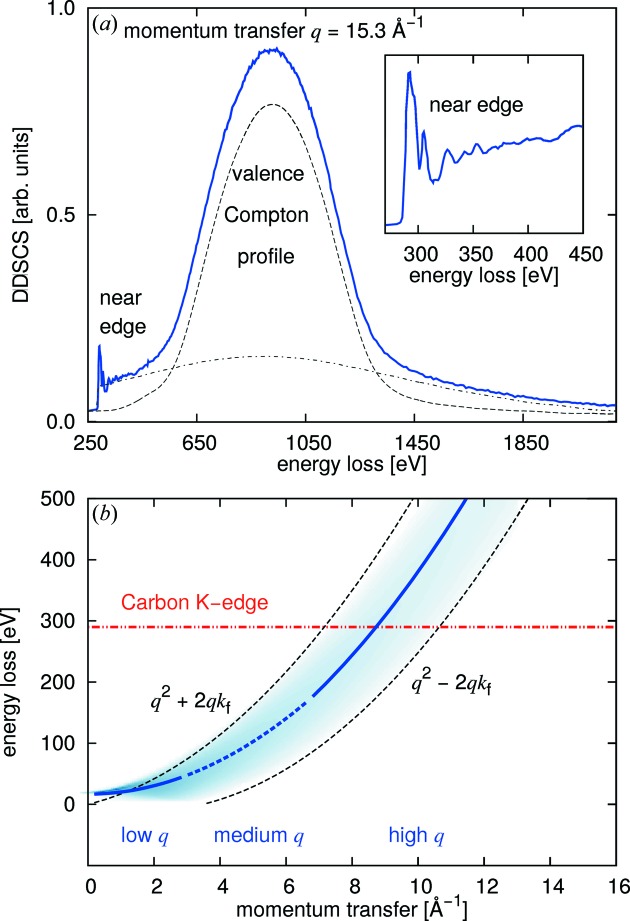
Figure 2.
(a) Measured spectrum from polycrystalline diamond with  = 15.3 Å−1 [data taken from Huotari et al. (2012 ▸)]. The response of the valence electrons is clearly visible as a broad peak centered at 950 eV. The inset depicts a zoom into the carbon K-edge region. (b) Dispersion of the valence electron response (blue curves). To clarify what we mean by ‘low’, ‘medium’ and ‘high’ momentum transfer, the line is divided into three regions (solid blue for low and high momentum transfer, dashed for medium momentum transfer). The onset of the carbon K-edge is marked by the horizontal line at 290 eV energy loss.

