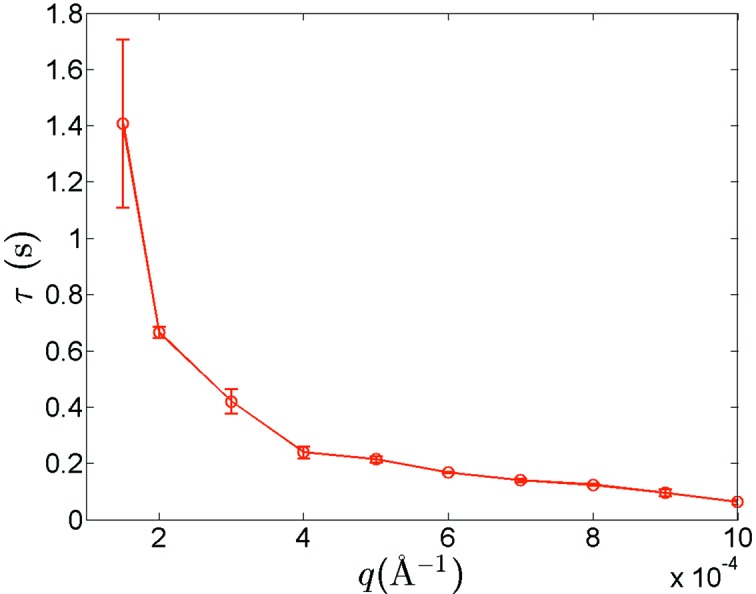
Figure 4.

Relaxation time τ as a function of q, obtained from fits of the intensity autocorrelation function using equation (3). Vertical bars represent the computed standard deviation uncertainties for the relaxation time determined at each q among the multiplexed results acquired using four individual slits.
