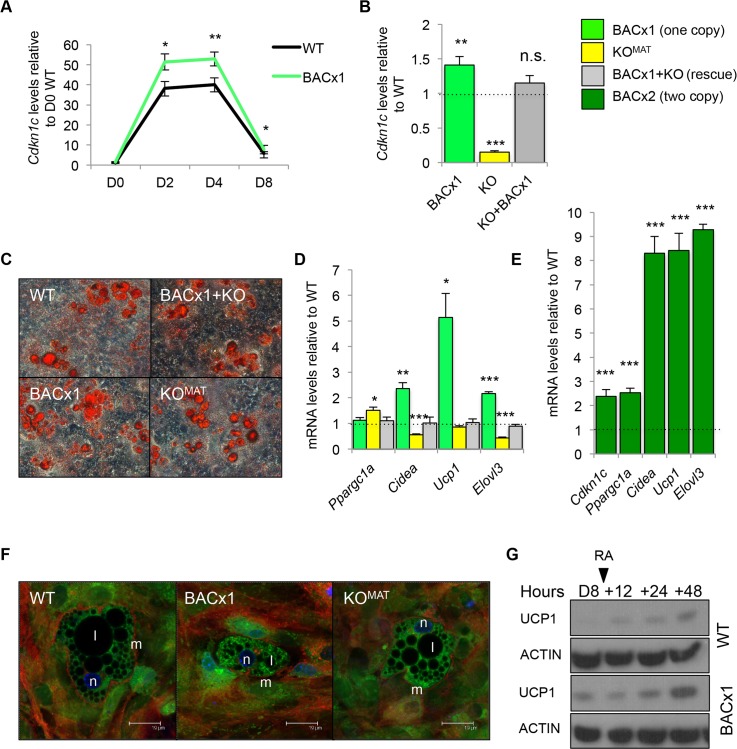
Fig 7. Cdkn1c induces a BAT-like gene program ex-vivo.
(A) QPCR of analysis Cdkn1c mRNA levels in WT and BACx1 MEFs over 8 days of adipocyte induction relative to WT day (D) 0. (B) QPCR analysis of Cdkn1c expression in WT, BACx1, KOMAT and BACx1+KO MEFs after 8 days of directed differentiation. (C) Oil Red O (ORO) staining of D8 adipocyte-differentiated WT, BACx1, KOMAT and BACx1+KO MEFs. All genotypes produced lipid filled adipocytes. (D) QPCR analysis of BAT marker genes Ppargc1a, Cidea, Ucp1, and Elovl3 in WT, BACx1, KOMAT and BACx1+KO D8 adipocyte-differentiated MEFs. As in vivo, key markers of BAT fate and function were elevated. Critically BACx1+KO MEFs(Cdkn1c expressed at WT levels) expressed the BAT markers at WT levels confirming that induction was in response to the transgenic elevation of Cdkn1c. (E) QPCR analysis of Cdkn1c and BAT marker genes Ppargc1a, Cidea, Ucp1, and Elovl3 in WT and BACx2 D8 adipocyte-differentiated MEFs illustrating further elevation of BAT markers driven by increased Cdkn1c dosage. (F) Confocal images of D8 adipocyte-differentiated WT, BACx1 and KOMAT MEFs. Membranes stained with Cell mask Deep Red plasma (633nm; red), nuclei stained with Hoechst 366243 (450nm; blue) and mitochondria stained with Rhodamine-123 (540nm; green). Fields shown were visualised under fluorescence microscope at appropriate wavelengths. Mitochondria indicated by m, lipid by l and nucleus by n. Scale bar = 19 d. (G) Western analysis of UCP1 and β-ACTIN in D8 adipocyte-differentiated WT and BACx1 MEFs and after addition of 1 mM 9-cis-retinoic acid for 48 hours. UCP1 protein detectable by Western analysis in transgenic but not WT samples, an effect amplified by exposure to the positive regulator of Ucp1 gene transcription, retinoic acid. For each QPCR analysis n = 4 genotypes per group taken from two independent litters; error bars represent ± s.e.m. * P <0.05; ** P <0.01; *** P <0.005.

