
Fig 4. Glucose competition.
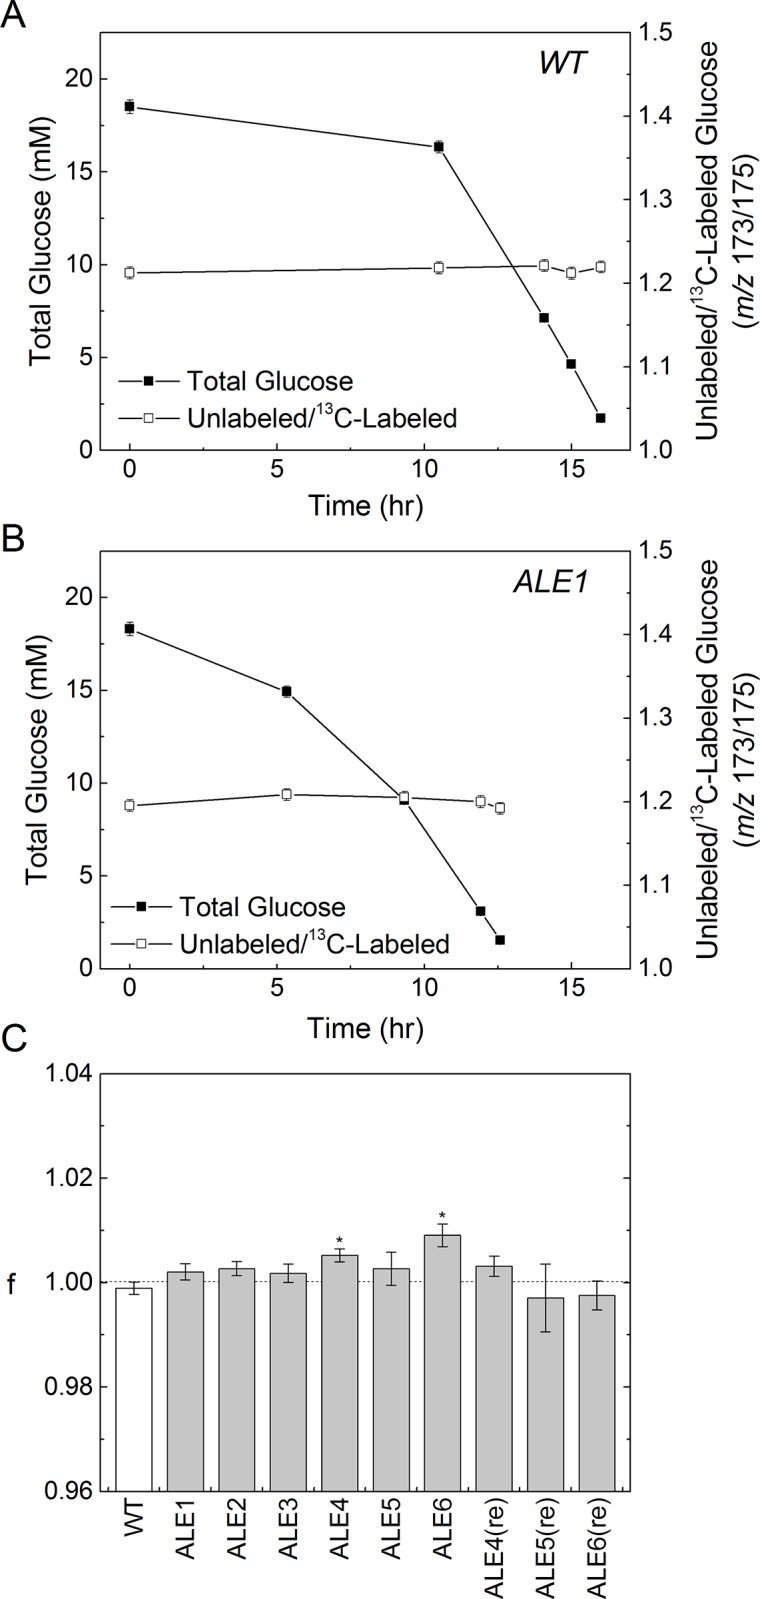
Results of glucose competition experiments, where the medium contained a mixture of 12C-glucose and 13C-glucose. Profiles of total glucose concentration and labeling ratio are shown for the WT (A) and one representative ALE strain culture (B). The estimated glucose preference factor “f” reflects the preference for 12C-glucose vs. 13C-glucose (C). An f-value of 1 reflects no preference, greater than one reflects a preference for 12C-glucose, and less than one a preference for 13C-glucose.