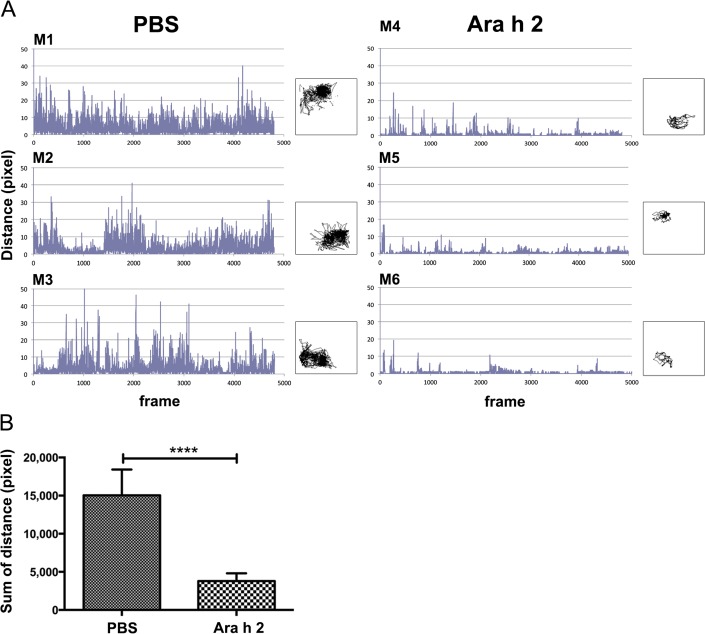
Fig 6. Horizontal physical activity of mice in the peanut allergy model.
Heat image frames of animals are captured (4 frames/second), and centre-of-heat-points and the distance among them calculated over a pre-set period of time. Y-axis: moved distance (pixel); x-axis: number of frames (images) captured during the observation period of 20 min. Mice M1-M3 were sham-treated (PBS), M4-M6 were specifically sensitized against peanut allergen Ara h 2 (Ara h 2), and all mice were i.v. challenged with Ara h 2. (A) Distance records of individual mice during 20 min; boxes: corresponding tracking curves of horizontal moves of each mouse. (B) Statistical comparison of the sum of moved distances between the PBS and Ara h 2 groups (mean+SD) showed a significant difference (****p<0.0001).

