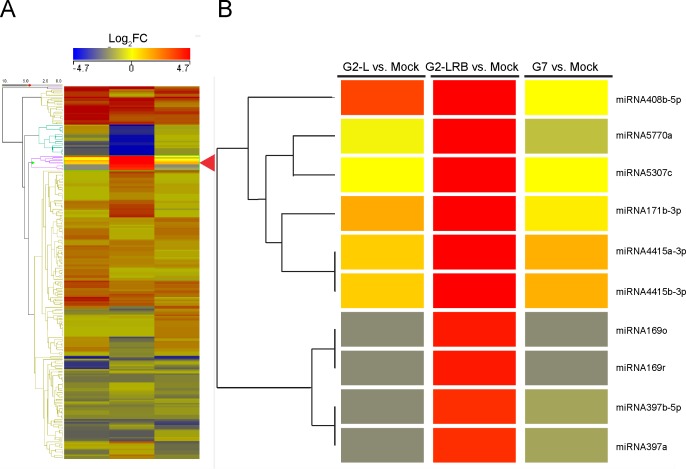
Fig 1. A hierarchical cluster analysis of miRNA expression profiles as a heat map depicting 253 differentially expressed miRNAs (DEMs) after infection by three SMV isolates (G2-L, G2-LRB and G7).
(A) A summary view of heat map generated using Strand NGS (http://www.strand-ngs.com/). (B) A detailed view of an exemplar branch showing DEMs differentially responsive to SMV isolates. Colors indicate the log2 fold changes (FC) with a ratio of SMV-infected sample versus mock-inoculated control according to the average of the normalized signal values. All downregulations are indicated with a negative sign and are shown in blue. All upregulations are shown in red colour. Read densities = RPKMs (Read count per kilobase of exon model per million reads); Normalized signal values = log2(RPKMs). Significance was determined by using a fold change threshold of at least 2.

