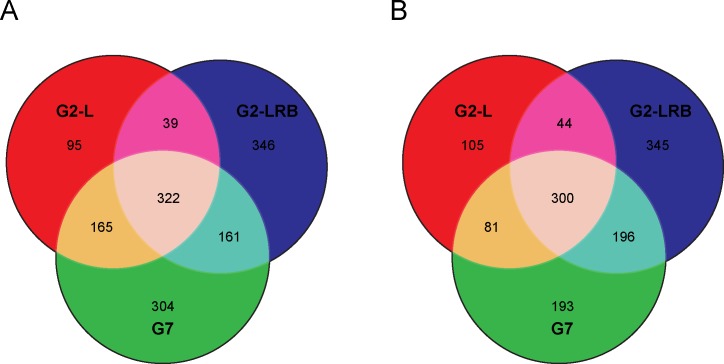
Fig 6. Comparison of differentially expressed genes (DEGs) in response to SMV infection.
(A) Venn diagram of significantly upregulated DEGs among G2-L, G2-LRB and G7 infection relative to mock-inoculated control. (B) Venn diagram of significantly downregulated DEMs among G2-L, G2-LRB and G7 infection in comparison with the mock-inoculated control.

