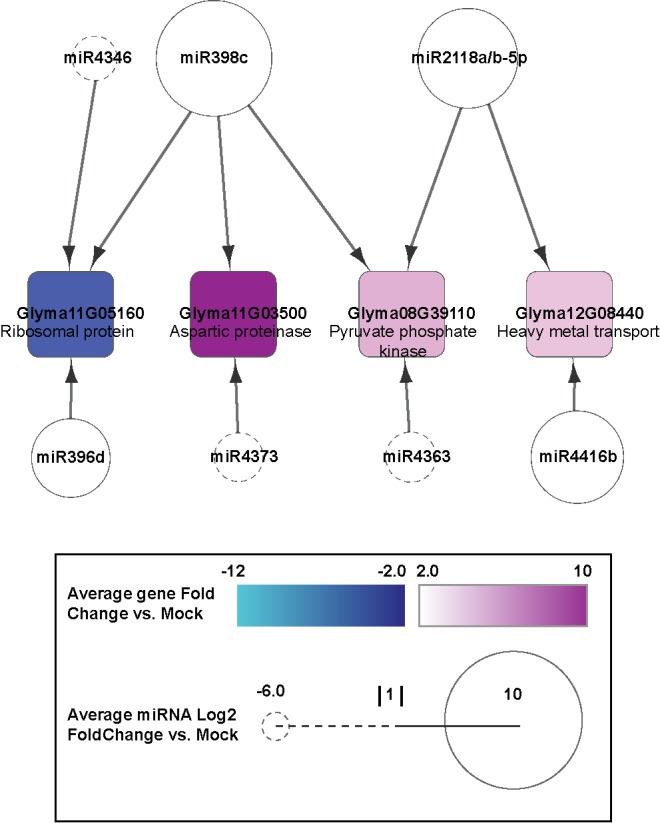
Fig 9. Regulatory connections of miRNAs and their target genes shared in infections by all the three SMV isolates.

miRNAs are shown as circles. Negative Log2 fold change is represented by a dashed line when negative, and a solid line when positive. Target genes are represented by squares. Expression fold change >2 ranges from cyan to dark blue when negative, and white to magenta when positive.
