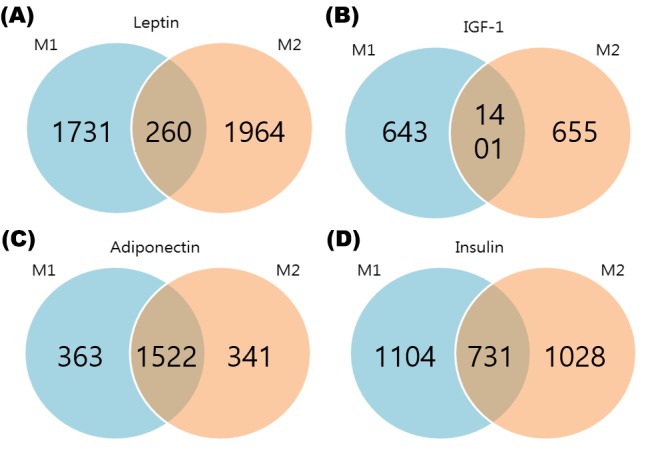
Fig 3. The Venn diagram of PAG.

Fig (A) shows detected genes that are significant with leptin. Fig (B) shows detected genes that are significant with IGF-1. Fig (C) shows detected genes which are significant with ADIPO. Fig (D) shows detected genes that are significant with insulin. In all of these four figures, Both M1 and M2 reveal a large number of different significant PAGs. Thus, we could assume that conditional distributions of expression levels, given group, are different from marginal distribution in many genes.
