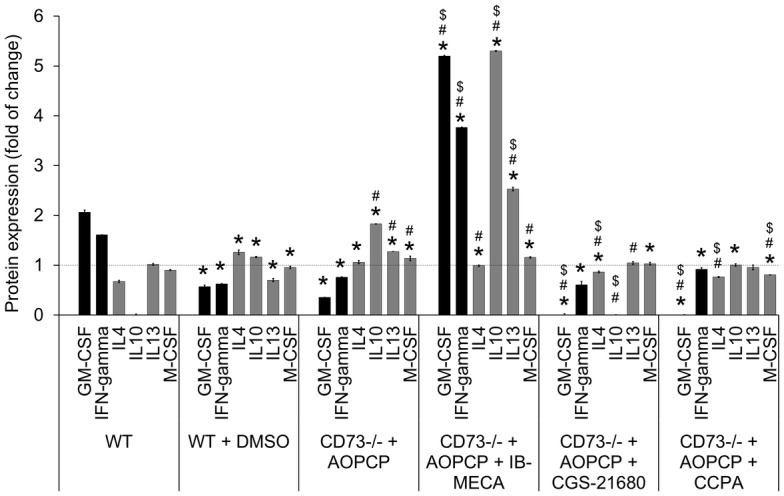
Fig 5. Stimulation of A3, A2A or A1 adenosine receptors induces changes in cytokines involved in macrophage polarization.

Cytokines were quantified in tumor lysates on the 14th day of s.c. growth in WT or CD73-/- mice. CD73-/- mice were treated with AOPCP and, where indicated, with specific agonist: IB-MECA, CGS-2168 or CCPA. For separate control of agonist solvent, WT mice were treated with DMSO. Semi-quantitative antibody microarrays were used to obtain protein expression profile. Graph shows the expression of the selected cytokines involved in the polarization to the MI or MII phenotype (black and gray bars, respectively) presented as the fold changes between groups calculated from mean values for each protein separately assuming that the average expression of such protein in all three control groups is equal to 1. *P<0.05 vs. WT, #P<0.05 vs. WT + DMSO, $P<0.05 vs. CD73-/- + AOPCP (other statistical differences are not shown).
