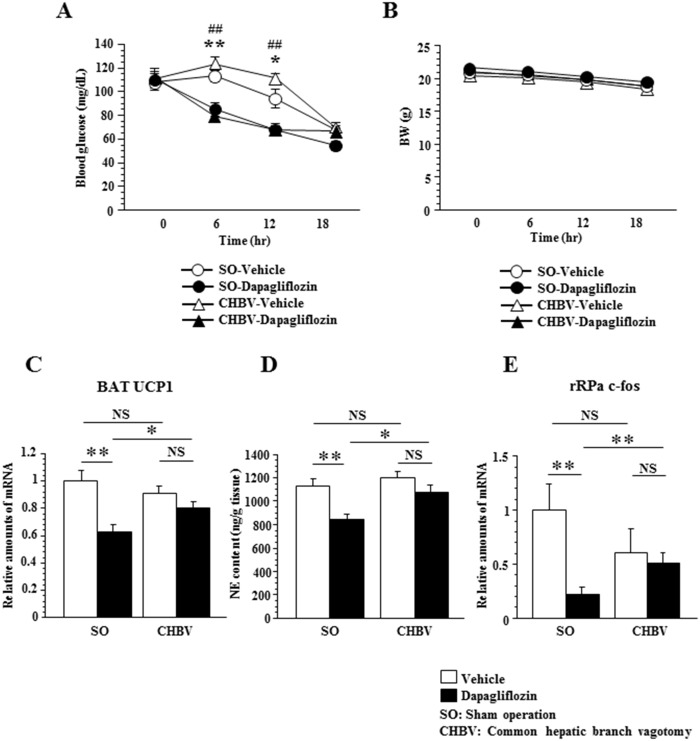
Fig 4. Common hepatic branch vagotomy attenuated suppression of BAT thermogenesis induced by dapagliflozin administration.
Plasma blood glucose (A) and BW (B) after dapagliflozin administration (n = 6–7 per group). Significance is indicated **(P < 0.01), *(P < 0.05) in SO-vehicle-mice versus SO-dapagliflozin-mice, ##(P < 0.01) in CHBV-vehicle-mice versus CHBV -dapagliflozin-mice. Relative amounts of UCP1 mRNA in BAT (C), NE content in BAT (D) (n = 6–7 per group) and relative amounts of c-fos mRNA in the rRPa (E) (n = 5–7 per group) 18 hours after dapagliflozin administration. Values shown are means ±SEM. Significance is indicated (**P < 0.01, *P < 0.05). NS = not significant.

