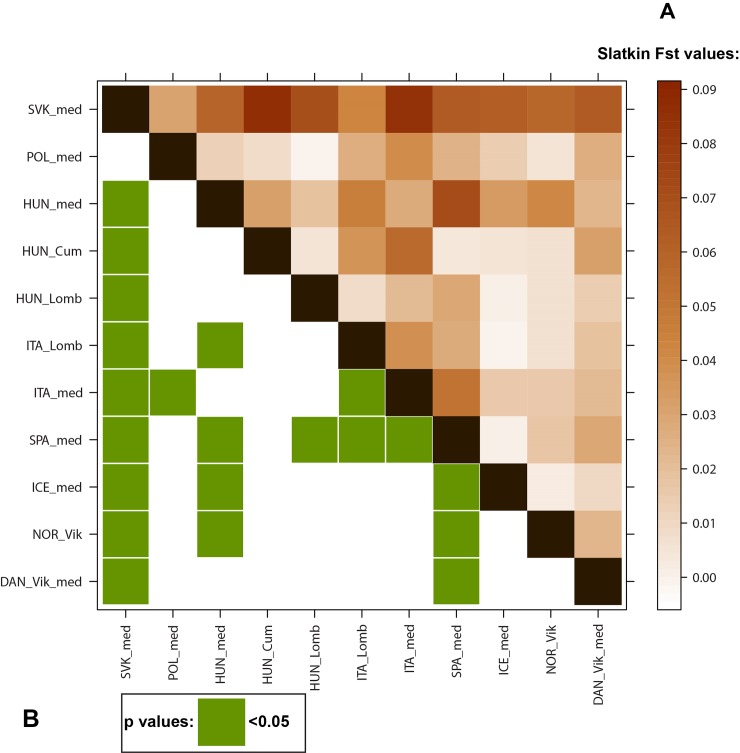
Fig 2. Levelplot of the linearized Slatkin population differentiation (FST) values and significant p values.
(A) Levelplot of the linearized Slatkin FST values of the European medieval populations. (B) significant p values (< 0.05) are indicated in green. The exact FST and p values and population information can be found in S6 Table.

