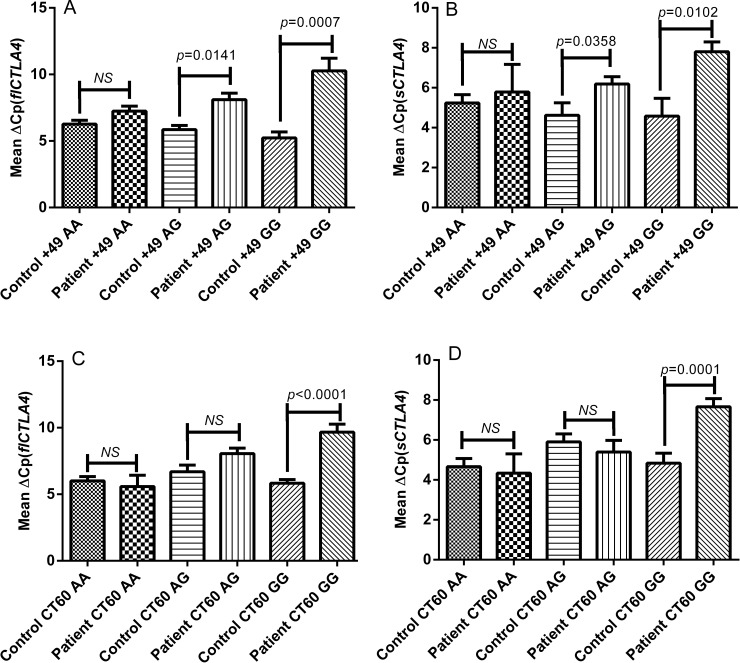
Fig 2.
Genotype—phenotype correlation of exon 1 +49A/G and 3’ UTR CT60A/G polymorphisms of flCTLA4 and sCTLA4 in controls and autoimmune hypothyroidism patients: (A) Relative mRNA expression of flCTLA4 with respect to +49A/G genotypes in 45 patients and 60 controls. None of the three genotypes AA (p = 0.0667), AG (p = 0.0141) and GG (p = 0.0007) in patients showed significant difference for flCTLA4 expression as compared to controls a suggested by Mean ΔCp. [NS = non-significant] (B) Relative mRNA expression of sCTLA4 with respect to +49A/G genotypes in 45 patients and 60 controls. None of the three genotypes AA (p = 0.6260), AG (p = 0.0358) and GG (p = 0.0102) in patients showed significant difference for flCTLA4 expression as compared to controls a suggested by Mean ΔCp. [NS = non-significant] (C) Relative mRNA expression of flCTLA4 with respect to CT60A/G genotypes in 45 patients and 60 controls. GG genotype showed significant decrease in the levels of flCTLA4 mRNA (p<0.0001) in patients as compared to AA and AG genotype (p = 0.5817 & p = 0.2379 respectively) as suggested by Mean ΔCp. [NS = non-significant] (D) Relative mRNA expression of sCTLA4 with respect to CT60A/G genotypes in 45 patients and 60 controls. GG genotype showed significant decrease in levels of sCTLA4 mRNA (p = 0.0001) in patients as compared to AA and AG genotype (p = 0.7099 & p = 0.7478 respectively) as suggested by Mean ΔCp. [NS = non-significant].

