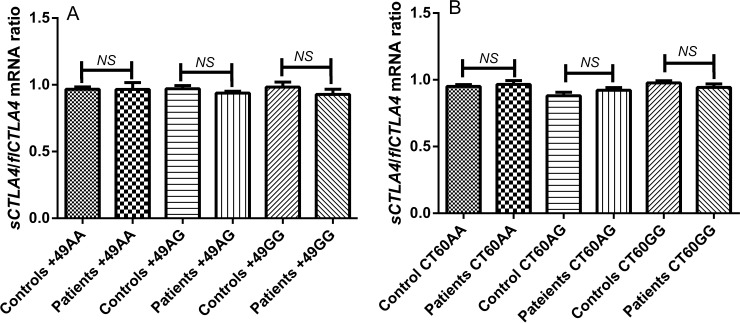
Fig 4.
Ratio of sCTLA4 and flCTLA4 mRNA expression with respect to +49A/G and CT60A/G genotypes in controls and patients: (A) sCTLA4/flCTLA4 mRNA ratio was analyzed with respect to +49A/G genotypes in patients and controls. None of AA, AG and GG genotypes showed significant difference in the sCTLA4/flCTLA4 mRNA ratio in patients compared to controls (p = 0.9724, p = 0.2378 and p = 0.3405 respectively). [NS = non-significant] (B) sCTLA4/flCTLA4 mRNA ratio was analyzed with respect to CT60A/G genotypes in patients and controls. None of AA, AG and GG genotypes showed significant difference in the sCTLA4/flCTLA4 mRNA ratio in patients compared to controls (p = 0.6213, p = 0.4425 and p = 0.2940 respectively). [NS = non-significant].

