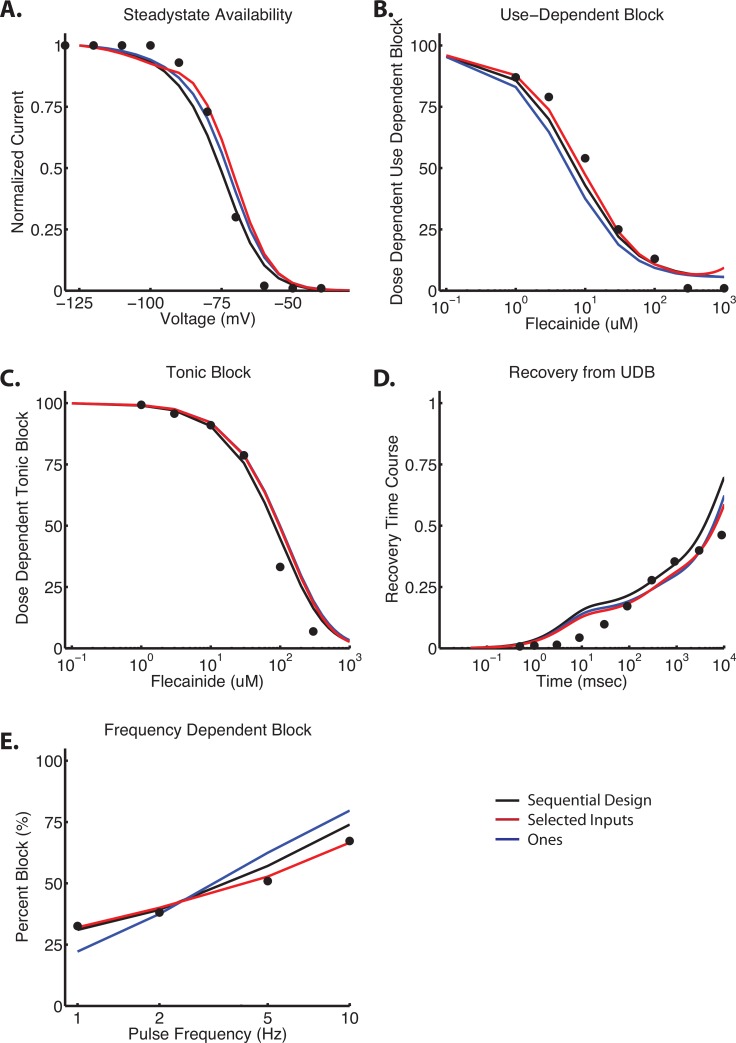
Fig 7. Analysis of initial conditions in charged flecainide model.
Shown are the results of 3 additional optimization routines for charged flecainide, all starting from different initial conditions. The black trace is from a sequential design strategy of 400 initial iterations (100 each) of SSA, Block, RUDB, and FDUDB. The optimization was then continued to convergence. Red inputs indicated an empirically derived (“hand tuned”) set of initial guesses (see Table 4). Blue traces indicate an initial vector of all 1’s–indicating that the drug bound rate constant = 1* the drug free rate constant. See text for further details.

