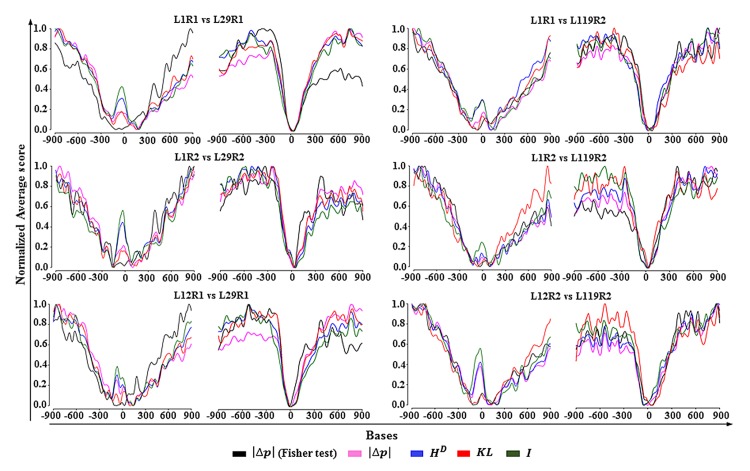
Fig 2. Density of DIMPs around transcription start and end sites.
In each graphic the bases at position zero denote the centers of the 3’ (left) and 5’ (right) untranslated regions. The DMPs are estimates for the 30th generation lines: L29 and L119 (replicates 1 and 2) in respect to 3rd generation lines: L1 and L12 from reference [19]. Fisher exact test and the corresponding particular cases of Eq 30 (DR = Dk) for information (Eq 3, Dk = Ik), Total variation (Eq 25, Dk = TVk), Kullback–Leibler (Eq 26, Dk = KLk) and Hellinger (, Eq 27) divergences were used in the estimation of DMPs without distinction between methylation contexts. The density of DIMPs based on the absolute difference of methylation levels (which is equal to TV) was estimated based on Fisher exact test (TV (Fisher test)) and on the CDF for TV according to Eq 30 (Dk = TVk). DMPs estimated by the “classical” methods can be overestimated or underestimated. Any method to estimate DMPs must take into consideration the statistical-biophysical nature of the methylation process at tissue or organ levels. Every sample follow an independent ontogenetic development and the action of the omnipresent thermal fluctuations on cells and tissues leads to different methylation profiles.

