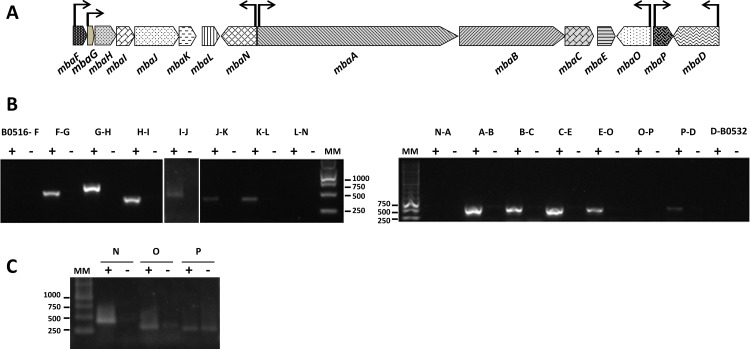
Fig 4. Expression of the mba genes from B. xenovorans LB400.
A, Gene organization of the mba operon. Genes are represented with block arrows indicating gene orientation. Proposed biosynthetic genes are shown in dark gray, transport and utilization genes in light gray, and regulation genes in black. Transcriptional units predicted from RT-PCR analyses are shown by horizontal line arrows, with the promoter regions depicted by the start of the arrows. B, RT-PCR analysis of transcripts from the intergenic regions of the mba gene cluster. C, RT-PCR analysis of the expression of the mbaN, mbaO and mbaP genes. Amplification products were subjected to electrophoresis in an agarose (1%) gel. MM, molecular size markers (1 kb and Express DNA ladder). Expression of each region was analyzed under iron-limitation (+) and without iron limitation (-).

