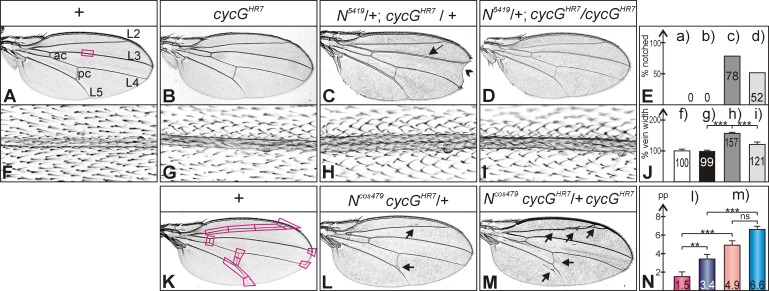
Fig 2. Genetic interactions between cycG and Notch mutants during wing development.
(A) Wing of a wild type control (+), characterized by five longitudinal veins (shown are L2 –L5) and an anterior and a posterior crossvein (ac, pc). The square depicts the approximate area enlarged in F)—I). (B) Homozygous cycGHR7 mutant wings have a wild type appearance. (C) Wings of heterozygous N5419 / +; cycGHR7 / + mutant females display notched wing tips with high frequency (arrowhead) and a thickened L3 wing vein (arrow). (D) Wings of a female fly N5419 /+; cycGHR7 / cycGHR7 has a more normal appearance. (E) Comparison of wing notching: neither wild type (a) nor cycGHR7 / cycGHR7 homozygous flies (b) show notched wings; (c) about 78% of the wings from N5419 / +; cycGHR7 / + doubly heterozygotes are notched (n = 646); (d) N5419 /+; cycGHR7 / cycGHR7 females display about 52% notched wings (n = 342). (F–I) Thickness of veins was measured on high magnification pictures as shown: F) wild type. G) cycGHR7 / cycGHR7. H) N5419 / +; cycGHR7 / +. I) N5419 /+; cycGHR7 / cycGHR7. (J) Vein thickness was measured in pixels and is shown relative to wild type (f) which was taken as 100% (n = 20), genotypes (f-i) are as in (F-I). Standard deviation is indicated. Statistical significance was determined by Student’s T-Test (*** p<0.001). (K) Wild type wing is shown with 11 positions used to evaluate vein phenotypes: thickened or ectopic veins were given a value of 1, normal veins a value of 0. (L) Ncos479 /+; cycGHR7 / + flies show a gain of function phenotype, typified by ectopic veinlets (arrows point to examples) appearing in about 1–3 positions. (M) The absence of CycG enhances the Ncos479 vein phenotype, with ectopic and thickened veins appearing in 5–7 positions (genotype, Ncos479 /+; cycGHR7 / cycGHR7) (arrows point to examples). (N) Numerical evaluation according to (K) of vein defects in (l) Ncos479 /+ heterozygous and (m) Ncos479 /+; cycGHR7 / cycGHR7 females (reddish colours) and males (bluish colours); (n = 10). The Y-axis represents the total number of phenotypically aberrant positions per wing (pp). Due to a gender bias, the phenotype is stronger in males than in females; female wings are shown in L) and M). Standard deviation is indicated. Statistical significance was determined by Student’s T-Test (ns, not significant [p≥0.5]; ** p<0.01; *** p<0.001).

