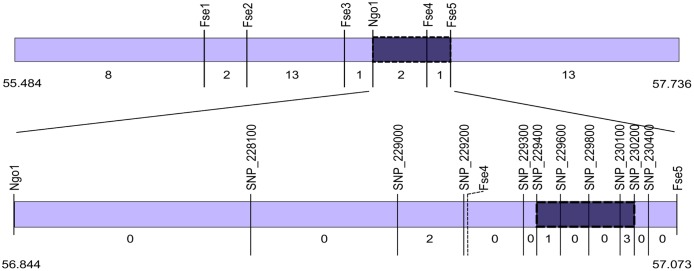
Fig 2. A schematic of the region of SBI-09 encoding Dw1.
The top bar shows the Dw1 locus delimited by QTL mapping in the F2. The region was refined in the F3 population (n = 75 for each of six families) using the DG markers labeled in the diagram. The numbers below the bar are the number of recombinants (both bars). Note that all members of one of the families (237) had a breakpoint in between Fse5 and the end of the region shown. The lower bar represents the delimited Dw1 locus defined by mapping in the F3 generation with SNP markers labeled. Dark purple shows the location of Dw1 based on fine mapping. SNP markers are named with the last six digits of the gene name of the gene the SNP is in or near. Fse4 is included for perspective though it was not scored in the F4.

