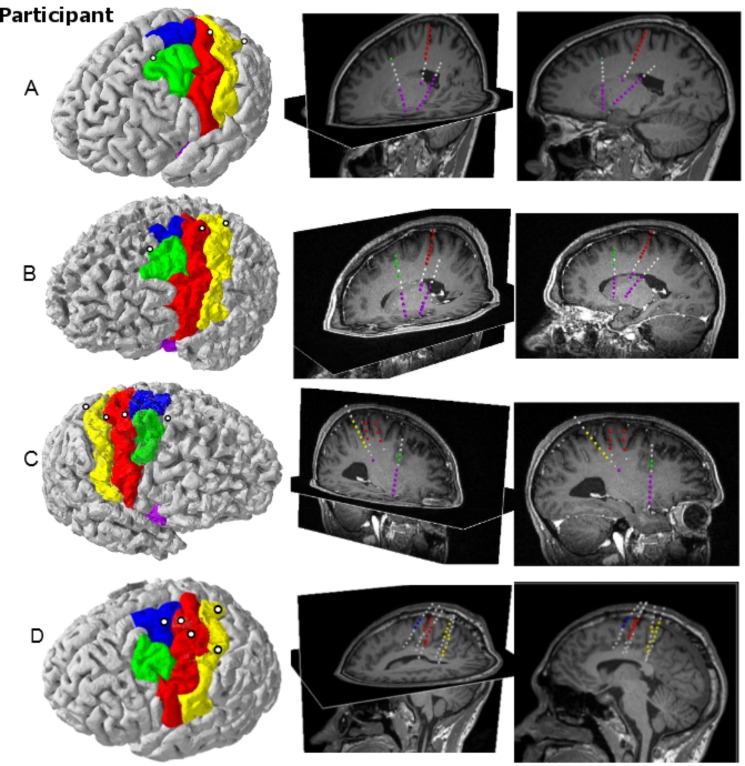
Fig 2. Locations of electrodes.
Each row corresponds to an individual participant (A-D). Left: Participant specific cortical surface reconstructions (red: motor cortex, yellow: primary sensory cortex, green: premotor cortex, blue: supplementary motor cortex, purple: insular cortex) and electrode penetration sites (white circles). Middle: Oblique views of sagittal and axial MRI slices showing the electrode trajectories. Electrode contacts are color-coded according to the cortical region they pass by or through. The MRI slices shown are located as close to the electrodes as possible without obscuring any of the contacts. Right: Sagittal views showing the actual depths of the electrodes.

