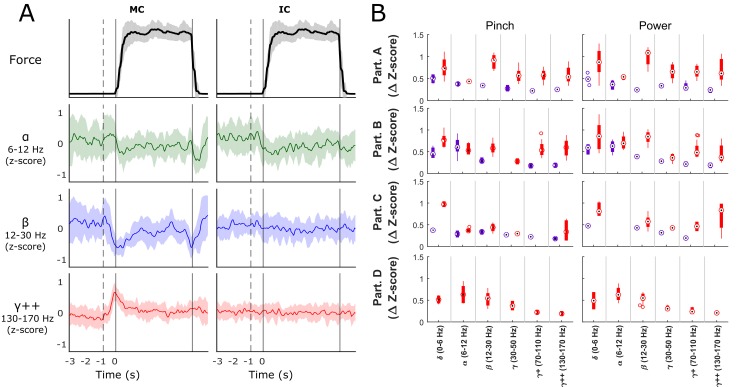
Fig 3. Signal Modulation during Force.
Panel A shows average z-score modulation over time on one motor cortex (MC) channel and one insular cortex (IC) channel in the alpha, beta and highest gamma features during hard force tasks. The solid vertical line corresponds to force onset with the dotted vertical representing the average target cue time. Shaded regions indicate confidence intervals for the signal means of each frequency band. Panel B shows the mean ± standard deviation depth of modulation (change in z-score from baseline) for statistically significant MC (red bars) and IC (purple bars) channels, organized by participant (rows) and by frequency band (x-axis) for each of the two grasping configurations. All participants showed significant modulation in the both motor and insular cortices (excluding D who did not have electrodes placed in the insula).

