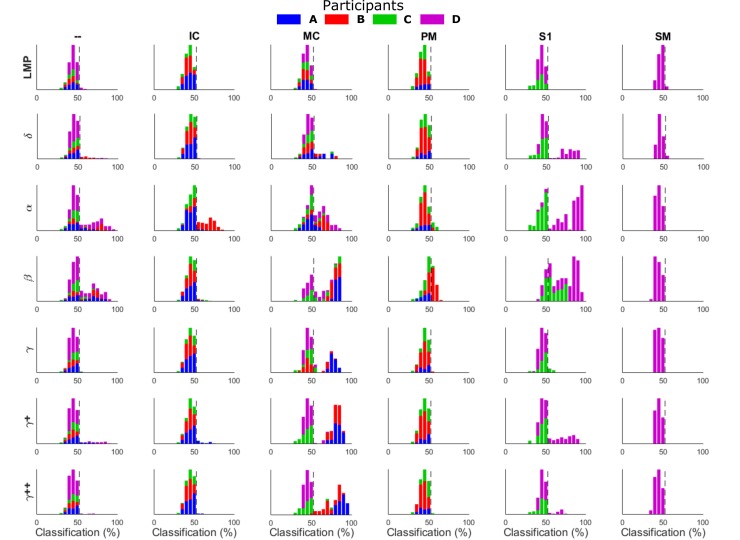
Fig 4. Classification density for single features.
Histograms show the distribution of feature classification accuracies for force versus rest classification. These bar values represent the single feature classification accuracies across 10 repeats of the cross-validation and are organized by brain region (— = White matter tracts, IC = Insular Cortex, MC = Motor Cortex, PM = Premotor Cortex, S1 = Primary Sensory Cortex, and SM = Supplementary Motor Area) and feature (LMP = Local Motor Potential, δ/θ = 0–6 Hz, α = 6–12 Hz, β = 12-30Hz, γ = 30–50 Hz, γ+ = 70–110 Hz, γ++ = 130–170 Hz). Colors correspond to each participant (blue = A, red = B, green = C, and purple = D) with pinch and power grasp configurations combined. Dotted line (52.67%) shows the high end of the 95% confidence interval for chance classification. All participants had motor cortical features that could be used for discrimination of force versus rest in contrast to other brain regions which were more participant specific.

