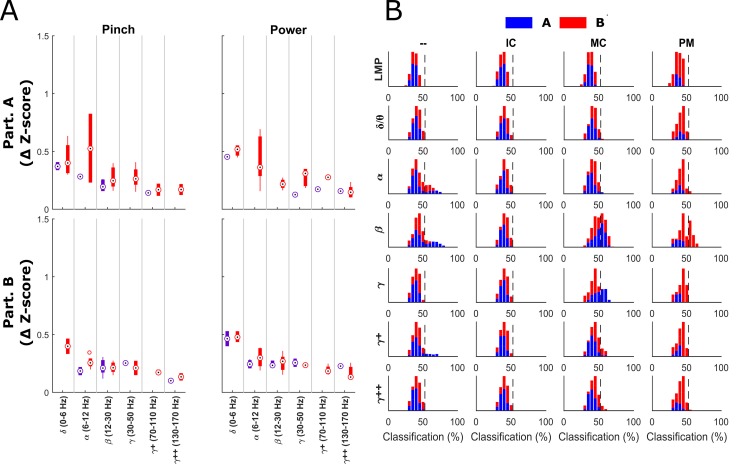
Fig 6. Imagined single feature modulation.
Panel A shows the mean ± standard deviation depth of modulation (change in z-score from baseline) for statistically significant MC (red bars) and IC (purple bars) channels, organized by participant (rows) and by frequency band (x-axis) for each of the two imagined force grasping configurations. Modulation was lower as a whole during imagination compared to Fig 3B with the exception of the alpha band for participant A. Panel B shows single feature classification distributions for imagined force versus rest trials. Participant A is shown in blue and participant B is shown in red. The chance level is shown as the dotted line. Histograms are arranged by frequency band (rows) and by brain region (columns).

