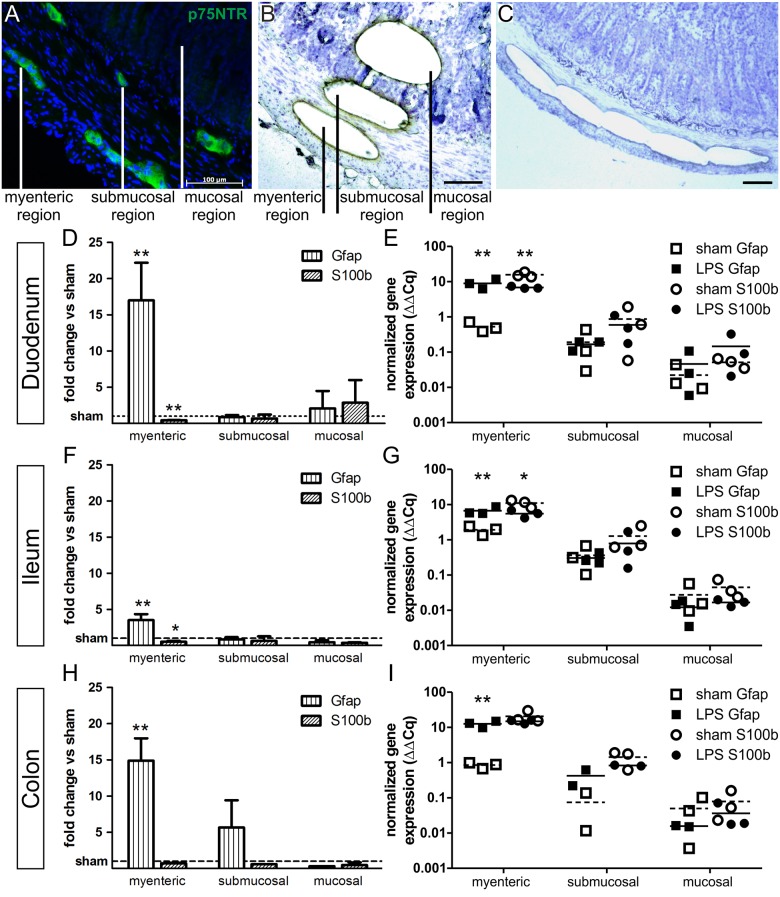
Fig 2. LPS-induced Gfap and S100b gene expression alterations are confined to the myenteric plexus.
(A) Immunohistochemical staining of p75 neurotrophin receptor (p75NTR) indicating the position of myenteric and submucosal plexus structures within the tissue. (B-C) Cresylviolet-stained tissue section showing exemplary myenteric, submucosal and mucosal tissue segments cut and catapulted for mRNA transcript level analysis (B) and sequential excision of segments, here shown for the myenteric region (C). (D, F, H) Quantitative PCR analysis of laser-dissected myenteric, submucosal and mucosal tissue segments of duodenal (D), ileal (F) and colonic (H) samples. In all intestinal regions the significant upregulation of Gfap up to the 17.2±5.2 fold change in the duodenum and downregulation of S100b gene expression is confined to the myenteric plexus. Results (mean ± standard deviation) are given as fold change relative to sham group set to 1. (E, G, I) Absolute normalized gene expression of Gfap (sqares) and S100b (circles) in duodenal (E), ileal (G) and colonic (I) segments, plotted on a logarithmic scale. Means of LPS-treated samples (filled symbols) are indicated with lines, means of sham-treated samples (empty symbols) are indicated with dashed lines. n = 3, *p<0.05, **p<0.01, scale = 100 μm.

